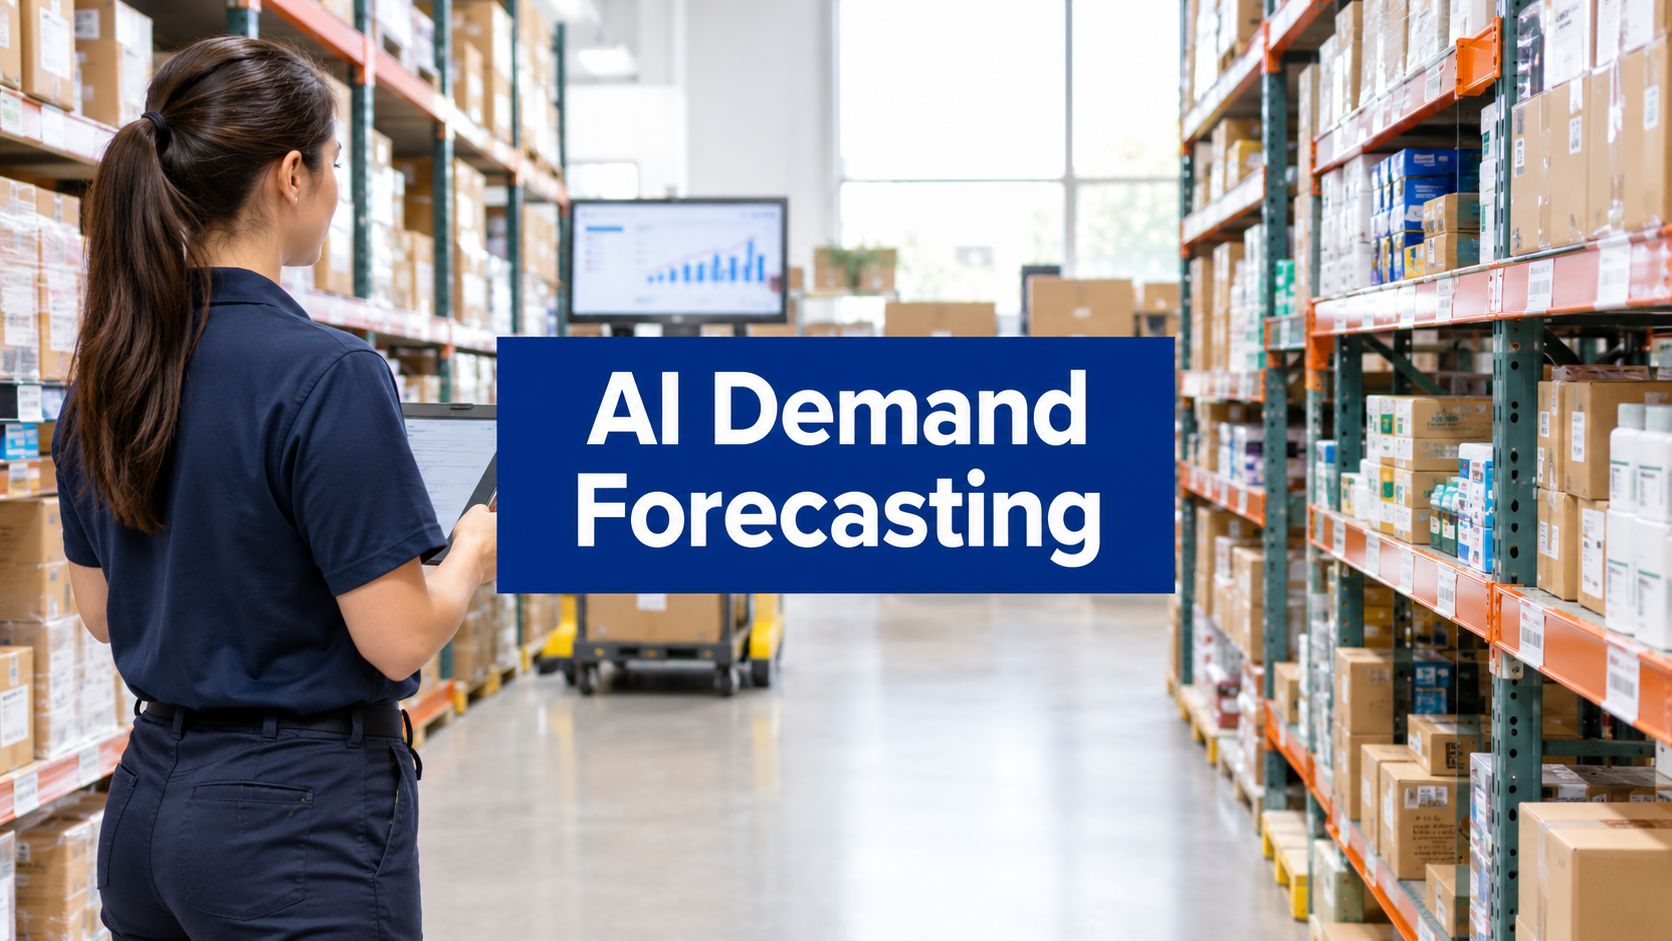


AI demand forecasting is no longer reserved for national chains with large data science teams. A mid-sized retailer can use it to answer practical buying questions: which products need replenishment, where stock should sit, how much safety stock is sensible, and when a promotion is likely to distort normal demand.
The technology only creates value when it connects to those decisions. A polished forecast that never reaches a buyer's order screen won't reduce working capital or prevent stockouts. The retailers that get results treat forecasting as an operating process, supported by clean data, clear review rules, and disciplined measurement.
The Forecasting Problem Every Retail Buyer Knows
A buyer at a mid-sized apparel retailer sees strong sales for a seasonal knitwear style. Last year's numbers look encouraging, so the buyer orders more for the next run. The product then loses momentum, stores receive stock faster than customers buy it, and distribution-centre space fills with units that need a markdown.
The buyer wasn't careless. They were working with a spreadsheet containing last year's sales, a few manual adjustments, and a reasonable instinct about the season. That process can produce an acceptable result for stable products. It struggles when weather, local events, pricing, promotions, channel shifts, and changing customer preferences alter the pattern.
The cost appears in two places:
Stockouts: A customer can't buy the product they want, so the retailer loses the sale or sends the customer elsewhere.
Overstock: Excess units tie up working capital, occupy warehouse capacity, and eventually require markdowns.
Manual rework: Buyers spend time reconciling exports, checking anomalies, changing formulas, and explaining decisions instead of improving the assortment.
Poor allocation: The chain owns enough stock overall, but the units sit in the wrong stores or channel.
Physical operations make this problem more visible. Retailers reviewing store, warehouse, and fulfilment requirements can use browse retail ecommerce material handling as useful background on how inventory decisions connect with movement and handling infrastructure.
Practical rule: A forecast is valuable only when it changes an order, allocation, replenishment, or markdown decision.
The practical answer isn't to replace every buyer with a black-box model. It's to give the buying team better signals and better order math. AI demand forecasting can combine internal sales history with external variables, identify changing patterns, and express uncertainty instead of hiding it behind one confident-looking number.
That shift matters in Canada, where Statistics Canada reported that 12.2% of businesses used AI to produce goods or deliver services in the second quarter of 2025, up from 6.1% a year earlier. The same survey found that 14.5% planned to use AI in the following 12 months, while 66.7% had no plans and 18.9% were uncertain, creating a substantial group that still needs a practical route from experimentation to deployment.
What AI Demand Forecasting Actually Means
AI demand forecasting uses machine learning to estimate future product demand from patterns in data. A retail model may learn from unit sales, price, promotion, calendar events, weather, store characteristics, stock availability, and product relationships. It doesn't just copy last year's sales. It tests how different signals interact and updates its view as new observations arrive.
Spreadsheet forecasting usually starts with a historical number. A buyer might take last year's weekly sales, apply a growth assumption, and adjust the result with personal knowledge about an upcoming campaign. That judgement remains useful, but the process is difficult to scale and can miss interactions across stores, products, and channels.
AI forecasting sits in the middle of a wider planning workflow:
Assortment: Decide which products and variants to carry.
Forecast: Estimate expected demand by product, location, channel, and time period.
Replenishment: Calculate when and how much to reorder.
Allocation: Place available stock where demand and service requirements justify it.
Markdown: Adjust price or exit inventory when demand falls below the plan.
A useful model doesn't return only one number. It can provide a likely range, allowing the buyer to balance service level, lead time, holding cost, and replenishment frequency. The AI in retail and ecommerce guide provides broader context on how these systems fit into digital retail operations.
Consider a product with an expected sales pattern across a 12-week planning window. A spreadsheet may show one unit target for each week. A forecasting system can show the central estimate alongside a lower and higher demand scenario, then connect those scenarios to safety-stock rules. The buyer can order against the likely case while checking whether the upper case would create a damaging stockout.
| Dimension | Spreadsheet Guess | AI Demand Forecasting |
|---|---|---|
| Main inputs | Historical sales and manual assumptions | Sales, price, promotions, calendar, weather, inventory, and store signals |
| Output | One adjusted estimate | Forecast with uncertainty, drivers, and scenarios |
| Scale | Difficult across many SKU-store combinations | Designed to score many combinations consistently |
| Buyer role | Rebuild and adjust the forecast | Review exceptions, context, and recommended actions |
| Planning connection | Often separate from replenishment | Can feed ordering, allocation, and markdown decisions |
The point isn't that a model knows the future. It doesn't. The point is that it can process more relevant evidence than a buyer can reasonably combine in a workbook, then leave the buyer with a clearer decision.
Modelling Approaches Retailers Can Choose From
Retailers do not need the fanciest model on the slide. They need a method that fits their data, their planning horizon, and the team that has to keep it running.
Statistical models
ARIMA, exponential smoothing, and Prophet work well for stable products with clear seasonality or trend. They are explainable, fast to test, and useful when demand behaves in familiar patterns. They lose strength once price, promotion, weather, and product interactions start driving the result.
For retailers that want a technical overview before choosing a path, guida ELECTE forecasting gives a useful summary of time-series methods without turning the decision into a software contest.
Classical machine learning
Gradient-boosting methods such as XGBoost and LightGBM are usually the practical middle ground. They handle engineered features, nonlinear relationships, promotion effects, store differences, and interactions between variables without the heavier setup that deep-learning work usually demands.
For most mid-sized retailers, I would start here. It is strong enough to beat a basic spreadsheet, easier to backtest, and easier to explain to a category manager than a neural network with many moving parts.
Deep learning
Temporal Fusion Transformers, N-BEATS, and LSTM hybrids can model long, multivariate demand series. They fit retailers with broad, consistent data and many related time series. They also require more data preparation, computing capacity, monitoring, and specialist expertise.
Deep learning does not fix weak inputs. If promotion history is incomplete or inventory availability is unreliable, a more complex model can learn the wrong lesson faster.
Statistics Canada describes Canadian predictive analytics projects that use methods including ARIMA-X and Prophet, along with XGBoost for economic indicators and machine learning for crop and hospital occupancy forecasting.
| Approach | Data Needed | Training Time | Interpretability | Typical MAPE Range |
|---|---|---|---|---|
| Statistical | Sales history, trend, and seasonality | Short | High | Category and data dependent |
| Gradient boosting | Sales plus engineered price, promotion, store, and event features | Short to moderate | Moderate to high with feature analysis | Category and data dependent |
| Deep learning | Large, consistent multivariate datasets | Moderate to long | Lower | Category and data dependent |
The table avoids invented accuracy bands. MAPE varies sharply with category, forecast horizon, intermittent demand, stock availability, and how the retailer treats promotions and outliers.
My recommendation: Start with gradient boosting, establish a statistical baseline, and earn the right to test deep learning later.
The Bank of Canada has noted that machine-learning models using payments data can improve short-term retail and wholesale trade forecasting, especially during crisis periods when a small number of payment streams become more important. The core lesson is operational, not ideological. Features need to shift in importance when the market shifts.
Data and Features That Drive Real Accuracy
Retailers often spend too much time comparing algorithms and too little time fixing the fields those algorithms receive. In practice, forecast quality usually changes more when feature definitions improve than when a retailer moves from one fashionable model to another.
A useful Canadian retail dataset would include a 12-month unit-sales history for each SKU and store combination, week-of-year indicators, holiday flags such as Family Day, Canada Day, and Black Friday, promotion details, price discount depth, product hierarchy, store format, and region. Outdoor categories can benefit from weather data sourced from Environment Canada.
The retailer should also record stock availability. A zero in the point-of-sale file doesn't always mean zero customer demand. It may mean the product was unavailable, the store had a counting issue, or the product was temporarily delisted. Training a model on those zeros without context teaches it to under-forecast.
Features that make the forecast useful
Calendar signals: Week-of-year and holiday indicators help separate regular seasonality from event-driven demand.
Commercial signals: Price and discount depth show whether a sales lift came from customer interest or a promotion.
Local signals: Weather, region, store format, and events help distinguish demand between locations.
Product relationships: Substitute and complementary products reveal cannibalisation and linked demand.
Derived signals: Rolling four-week averages, log transformations, and days since the last promotion can expose patterns hidden in raw values.
The Canadian retail evidence is clear on the direction. Combining sales history with weather, pricing, promotions, holidays, product characteristics, and events helped one Canadian retailer reduce inventory investment by 19% over two years.
The difficult work is usually data plumbing. POS exports may use different product identifiers from the inventory system. Promotion logs may omit local campaigns. Product hierarchies may change after a range reset. Store openings, closures, transfers, and stockouts can create breaks that look like demand changes.
Before exploring deep learning, create one trusted dataset with clear ownership. Document the grain, time zone, product keys, inventory definitions, promotion rules, and missing-value treatment. For related guidance, see AI inventory management for ecommerce. A smaller clean dataset will usually beat a larger, inconsistent one.
A Practical Roadmap from Pilot to Production
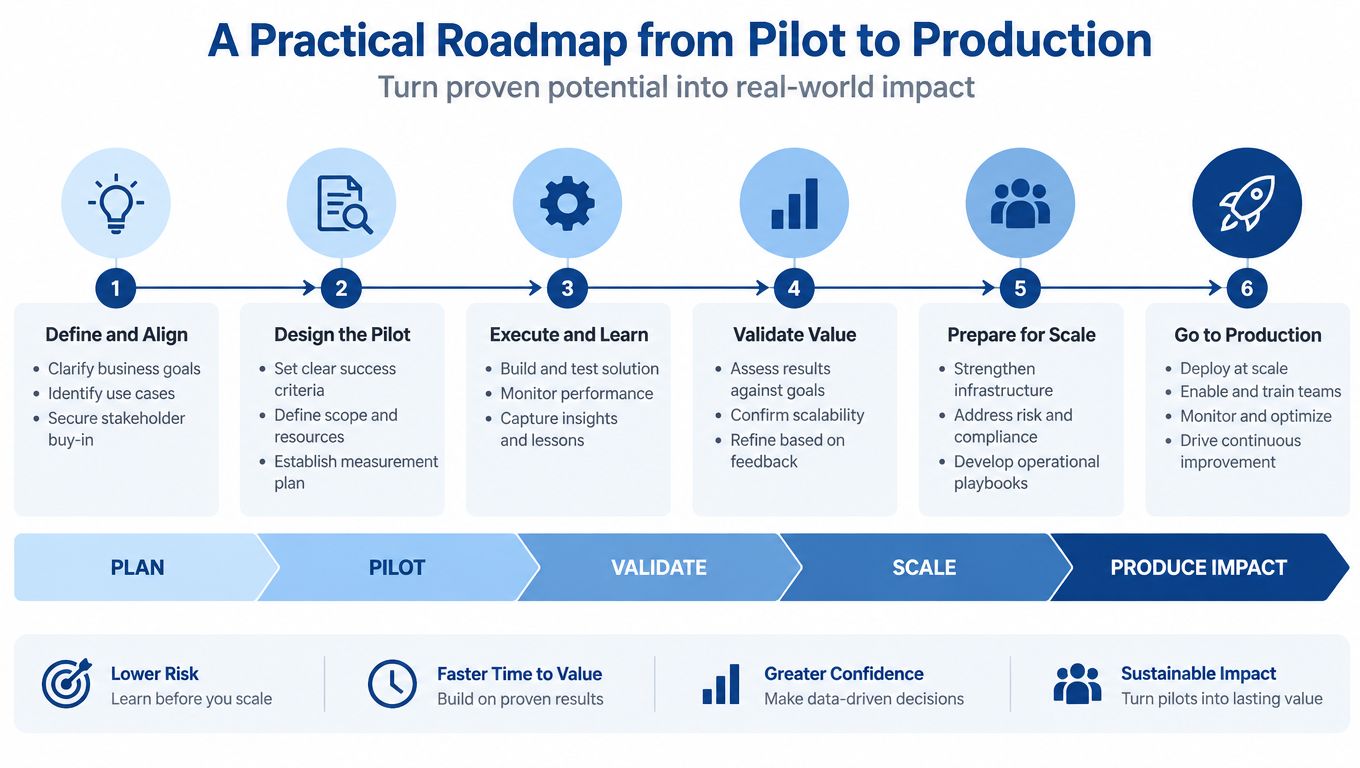
A forecasting pilot can look accurate in a notebook and still fail in the buying meeting. If the recommendation does not reach the buyer's weekly workflow, overrides go unrecorded, and inventory results remain invisible. The pilot must prove that the forecast changes a decision, not just that a model produces a plausible chart.
Keep the first release narrow. A small retailer can test the operating process without turning the project into a catalogue-wide integration effort.
Start with a controlled category
Choose a product group with visible stockouts, excess inventory, or frequent manual adjustments. Export POS, promotion, inventory, and event data into one consistent file. Define the product, store, and time grain before modelling. A contained category gives the team enough demand variation to test ordering decisions while keeping errors easy to inspect.
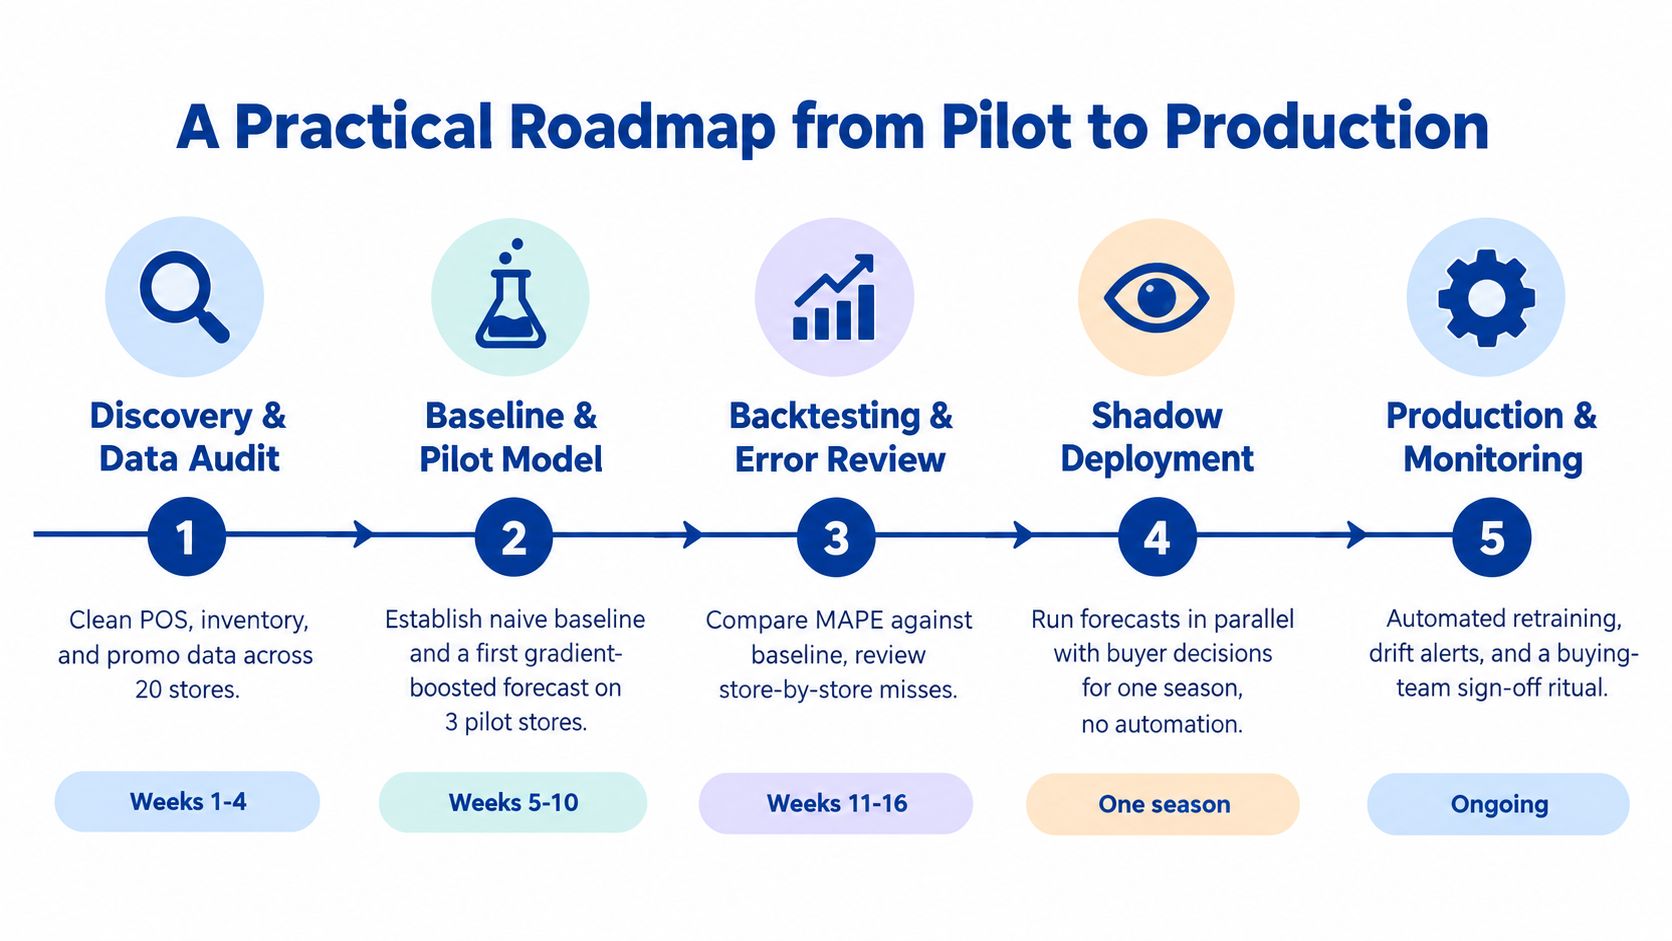
Set a naive baseline, then compare it with a Prophet or LightGBM model. Evaluate both against a holdout period, never against the training data. Have the buyer review the largest misses and classify each one: promotion, stockout, product change, or data defect. That review often improves the process faster than switching algorithms.
Put a human beside the model
Expand the pilot only after the team can explain its errors. Give a merchandising reviewer responsibility for challenging recommendations and recording each override. An override can reveal a product launch, local event, supplier constraint, or range decision that the dataset does not represent.
Run the AI forecast beside the buyer's existing forecast in the weekly planning workflow. Keep both views active, compare the resulting decisions, and make the review quick enough for planners to repeat. Do not automate purchase orders at this stage. First establish when the recommendation should be accepted, adjusted, or rejected.
The forecast also needs a route into the systems that run replenishment. If it cannot reach the ERP, inventory tool, or buying workflow, it remains a report. The AI in supply chain and logistics operations resource explains the wider operational requirements.
Define the production gate
Retire a spreadsheet only when the AI process has earned operational trust. Track forecast error, stockouts, overstock, inventory investment, service level, and override behaviour. Use an override rate below 30% and performance that beats the human-only process across a consistent eight-week window as the planned pilot gate. These are operating rules for this approach, not universal industry benchmarks.
Production also needs a named owner. That person monitors data freshness, feature drift, model failures, and unusual forecast changes, then assigns a response when something breaks.
Public-sector forecasting programs show why maintenance matters. Statistics Canada applies nowcasting and machine learning to economic, crop, hospital occupancy, and PPE supply-and-demand planning workflows. Environment and Climate Change Canada also prioritises hybrid numerical and machine-learning forecasting systems. A dependable retail forecast comes from a maintained pipeline, clear ownership, and disciplined ordering reviews, not model selection alone.
Real Canadian Retail Use Cases Worth Studying
Canadian retailers provide practical lessons because their AI projects connect forecasts to ordering, staffing, and replenishment decisions. For a mid-size retailer without a data science team, that connection matters more than a model's headline accuracy.
Loblaw's AI assistant, Robin, helps store managers monitor inventory levels and staff scheduling in real time. When weather models forecast a rapid thaw in Calgary, the system increases shipments of sump pumps and sandbags to affected stores. The implementation lesson is clear: add local external signals only when they change a specific buying or allocation decision. A forecast that cannot trigger an action is an expensive report.
Metro shows why fresh food requires finer planning. The retailer predicts daily demand for more than 5,000 fresh products in Quebec stores. Fresh products need store-level forecasts tied to ordering cadence, availability, shelf life, and waste. Buyers should therefore measure the system by improved order quantities and reduced waste, not forecast accuracy alone.
Best Buy Canada illustrates the execution layer. The retailer selected RELEX to improve inventory visibility, automate planning, support omnichannel operations across stores and distribution centres, and include supply-chain constraints in replenishment planning. The practical takeaway is to connect forecasting with lead times, capacity, inventory positions, and replenishment rules before expanding the model. Software adoption by itself does not improve working capital.
| Retailer | Category | Key Data Signals | Operational Lesson |
|---|---|---|---|
| Loblaw | Store inventory and staffing | Inventory levels, staffing data, local weather | Local signals can trigger targeted shipments |
| Metro | Fresh products | Daily store-level demand and product-level patterns | Perishables need granular ordering decisions |
| Best Buy Canada | Omnichannel retail | Inventory visibility, planning workflows, store and distribution-centre constraints | Forecasting must connect to replenishment mechanics |
A Canadian university research centre describes retail operations models that predict future demand and optimise stock levels, locations, and replenishment policies. The decision variables include lead time, holding cost, service level, and replenishment frequency. Those variables should appear in the pilot's success criteria and ordering workflow.
The right question is whether a forecast supports the right stock level at the right location, at an acceptable replenishment cost and timing. Build that decision loop first. Model sophistication can follow.
Risks, Trade-offs, and Your Next Steps
AI demand forecasting fails in predictable ways. Retailers overfit promotional spikes, treat stockout periods as weak demand, ignore new products with no history, and continue using a model after the assortment or channel structure has changed.
The failure modes
Promotional overfitting: A one-off discount can look like a permanent demand lift. Use holdout backtesting, promotion flags, and explicit event treatment.
Cold-start products: A new SKU has little or no sales history. Borrow information from product attributes, comparable items, category patterns, and launch assumptions.
Biased stockout data: Historical sales record what the retailer sold, not necessarily what customers wanted. Add availability and lost-sales context where possible.
Cannibalisation: A new substitute can take sales from an existing product. Use product relationship features and cannibalisation matrices rather than forecasting every SKU independently.
Model drift: Range changes, store changes, pricing changes, and new channels can make old relationships unreliable. Use champion-challenger retraining and monitor error by category and location.
Planner resistance: Buyers won't trust an unexplained recommendation that disrupts their work. Embed a forecaster or product owner inside the planning team and make overrides visible.
There are commercial trade-offs too. Cloud inference creates an operating cost. A packaged platform can create vendor lock-in. Complex models can leave category managers frustrated when they can't understand the recommendation. Explainability isn't a presentation feature. It determines whether a planner will use the output when the forecast conflicts with experience.
A Canadian supply-chain source argues that data quality and feature selection matter more than model size, and reports that digital-twin users have seen up to a 15% reduction in safety-stock costs and a 12% improvement in order-fulfilment rates within roughly two years. Treat those figures as directional evidence from that source, not as a promise for every retailer.
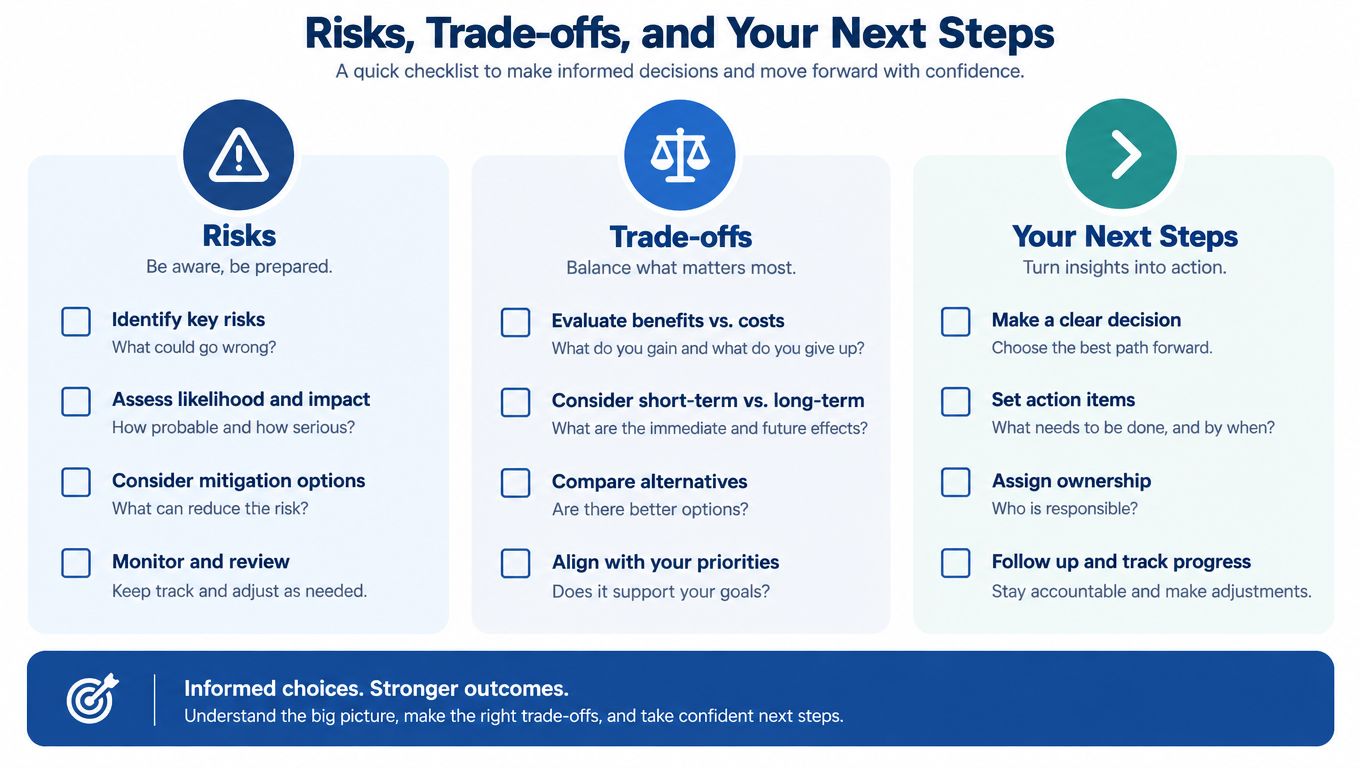
A 30-day action checklist
Audit the data: Confirm SKU, store, sales, inventory, promotion, price, and product-hierarchy definitions.
Choose the pain: Select a category where stockouts, overstock, or manual rework are visible.
Set the baseline: Record the current forecast method and decision metrics before testing AI.
Shortlist vendors: Ask how each option handles missing data, cold starts, overrides, integrations, and monitoring.
Run a narrow pilot: Compare a transparent baseline with gradient boosting and review the largest errors with buyers.
Define the production gate: Agree on accuracy, inventory, service, and adoption measures before anyone sees a success chart.
Cleffex Digital Ltd offers software development and AI solutions that can support retail and ecommerce use cases such as demand forecasting, replenishment automation, and pricing decisions based on sales history, seasonality, market trends, and external signals. Visit Cleffex Digital Ltd to discuss a focused forecasting pilot that connects better data to practical inventory decisions.