


Ecommerce predictive analytics is all about using your historical and real-time data to get a clear picture of what’s coming next for your online store. It’s less like a crystal ball and more like having a seasoned business partner who can forecast future trends, anticipate customer behaviours, and flag potential issues before they happen.
Think of it as the ultimate tool for knowing what your shoppers will buy next, which marketing campaigns will actually resonate, and which customers might be getting ready to churn.
Looking Beyond the Past to Shape the Future

Most online businesses live and breathe standard analytics. These reports are your rearview mirror. They tell you exactly where you’ve been. You can see past sales figures, website traffic, and conversion rates, which is all crucial information. But it only tells half the story. It describes what has already happened, leaving you to react after the fact.
Predictive analytics completely flips that script. It takes that same historical data and uses it to look forward, through the windscreen. It’s the difference between a shopkeeper who just reads last month’s sales report and one who knows their regulars so well they have their favourite items ready before they even ask.
The Shift From Reactive to Proactive
This is where your business strategy can fundamentally change from reactive to proactive. By spotting subtle patterns in your data, predictive models can generate surprisingly reliable forecasts about what’s on the horizon. At its core, this is a specialized form of artificial intelligence, so it helps to have a foundational understanding of AI development services.
This shift gives you the power to make smarter, data-driven decisions that have a real impact on your bottom line. Instead of guessing which products to restock, you can forecast demand with much higher accuracy. Rather than blasting generic promotions to your entire email list, you can pinpoint which customers are most likely to respond to a specific offer. You can learn more about how AI is redefining the retail shopping experience in our detailed article.
Fuelling Growth In A Competitive Market
In today’s crowded ecommerce world, this kind of foresight isn’t just a nice-to-have; it’s a major competitive advantage. Just look at the Canadian eCommerce industry, which generated approximately US$63.9 billion in revenue and continues to show steady growth year after year. A market this dynamic is the perfect environment for using predictive analytics to fine-tune everything from your inventory management to your marketing spend.
By turning your historical data into actionable insights about the future, predictive analytics gives you the tools to:
- Boost Sales: Get ahead of customer needs and deliver a truly personalized shopping experience.
- Reduce Waste: Optimize your inventory levels to avoid costly overstocking or stockouts.
- Improve Retention: Identify customers who are at risk of leaving and take steps to win them back.
How Predictive Analytics Models Actually Work
So, how does all this predictive magic actually happen? To really get a handle on ecommerce predictive analytics, we need to peek behind the curtain. It might sound incredibly complex, but the core ideas are surprisingly intuitive. It all boils down to a few key types of models, each one built to answer a different kind of business question.
Think of these models as a small, specialized team you’ve hired to make sense of your data. You’ve got an expert sorter, a master forecaster, and a brilliant detective who’s a pro at uncovering hidden patterns. Let’s get to know this team and see how they turn raw numbers into real-world business strategy.
Classification Models: The Expert Sorters
Classification models are the organizational gurus on your data team. Their main job is to sort customers, transactions, and website visits, into specific, predefined buckets. They do this by studying your past data where the outcome is already known, learning to recognise the patterns that lead to a particular result.
For example, a classification model can sift through thousands of past customer profiles to learn the subtle differences between a one-time buyer and a loyal, repeat customer. It picks up on signals like purchase frequency, average order value, and browsing behaviour to build its “sorting” logic.
Once it’s trained, you can show it a new customer, and it can answer critical yes-or-no questions with impressive accuracy:
- Is this visitor likely to abandon their cart? (Yes/No)
- Will this customer make a second purchase within 30 days? (Yes/No)
- Is this shopper at risk of churning in the next quarter? (Yes/No)
This lets you segment and act proactively. Imagine an online fashion retailer. Instead of blasting a 25% off coupon to their entire email list, they could use a classification model to pinpoint shoppers who are most likely to be swayed by a discount, sending the offer only to that receptive group. That’s smarter marketing.
Regression Models: Your Business Forecasters
While classification models answer “which one,” regression models are all about “how much.” These are your forecasters, and their specialty is predicting a specific, continuous number, like revenue, sales volume, or customer lifetime value. This is where you get the hard numbers needed for serious planning.
So, instead of just telling you if a customer will buy again, a regression model can estimate how much they’re likely to spend over the next six months. It arrives at this figure by looking at variables like their past spending habits, the product categories they love, and how often they browse your site.
A huge application of ecommerce predictive analytics is in demand forecasting. A regression model can chew on past sales data, account for seasonality, and even factor in your upcoming marketing campaigns to predict exactly how many units of a specific product you’re going to sell next month.
This kind of foresight is a game-changer for inventory management. Picture a Canadian outdoor gear company gearing up for winter. A regression model can forecast the demand for a specific style of winter jacket, helping the business order the right amount of stock to sidestep both costly overstock and frustrating “sold out” notices.
Clustering Models: The Insight Discoverers
Finally, we have the detectives of the group: clustering models. Unlike the other two, these models don’t start with a specific question or a predefined outcome. Their job is to dive into your data and find natural, hidden groupings or “clusters” of customers based on what they have in common.
You might think you have a good grasp of your customer segments, but clustering almost always uncovers surprising new groups you never knew existed. For instance, a model might analyze your sales data and find a small but distinct cluster of customers who only buy eco-friendly products, and almost always between 10 PM and 1 AM.
This image gives a simplified look at how customer segments can be structured based on what people buy and how they behave.
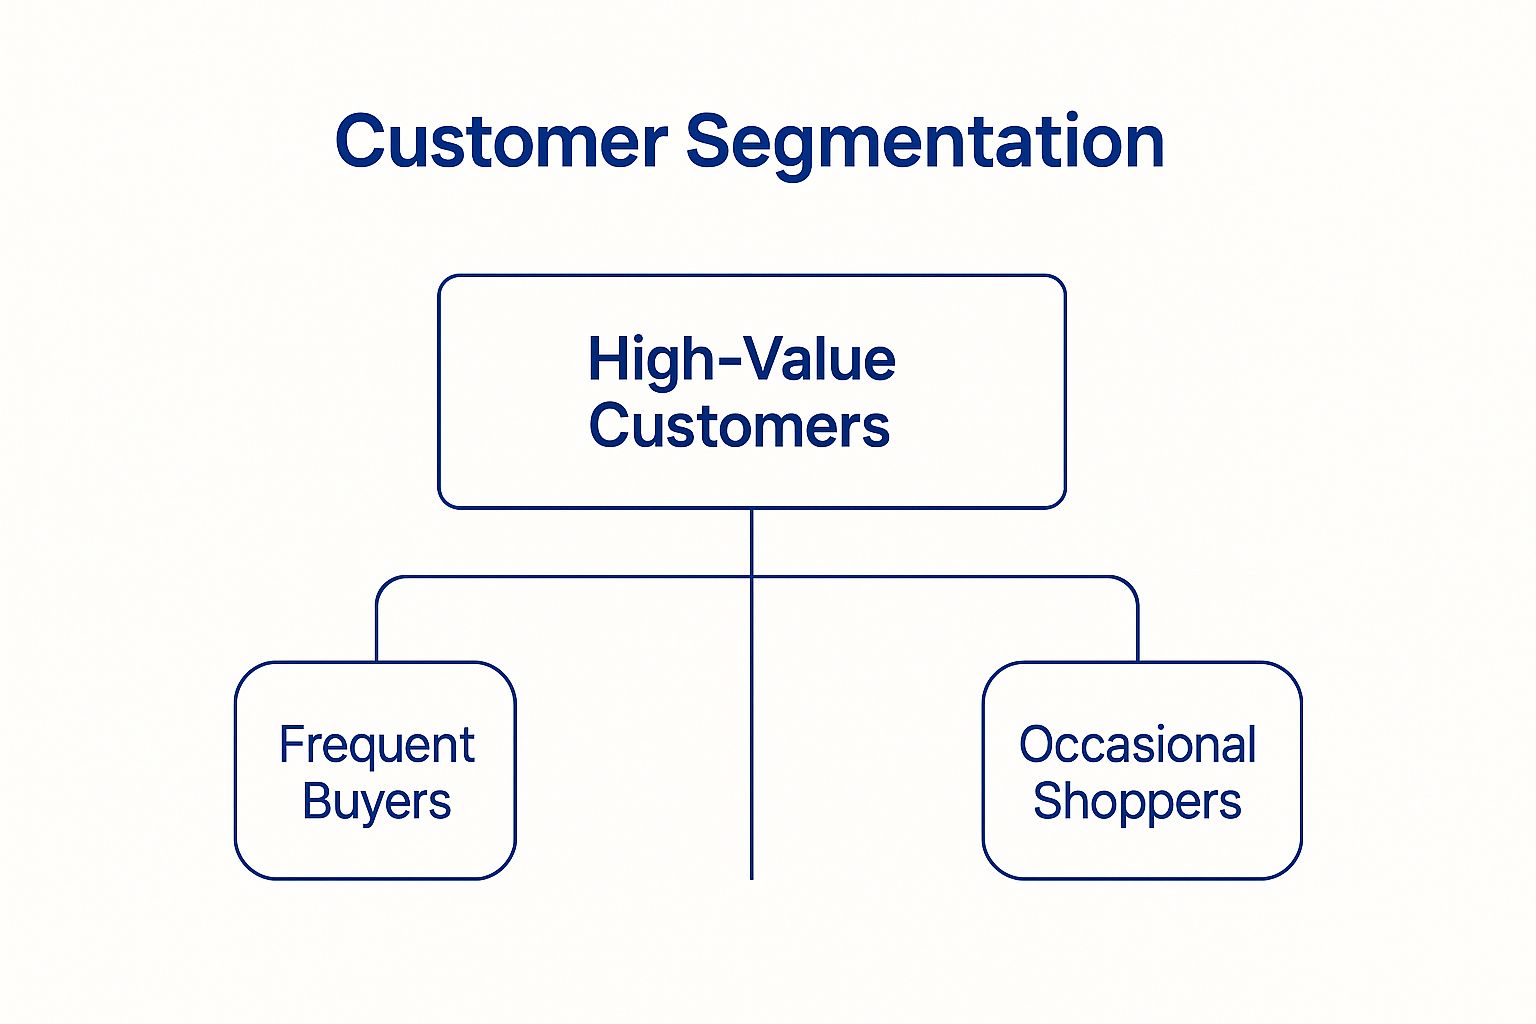
Seeing these groups laid out visually helps businesses create marketing that actually resonates with each distinct audience.
This kind of insight is pure gold for personalization. Once you’ve identified these hidden segments, you can create hyper-targeted marketing campaigns, smarter product recommendations, and website content that speaks directly to their unique interests. A home goods store might discover a “new homeowners” cluster who consistently buy a specific mix of items, prompting the store to create a targeted “New Home Starter Kit” bundle just for them.
Core Predictive Analytics Models for Ecommerce
To bring it all together, here’s a quick-glance table breaking down these fundamental models. Think of this as your cheat sheet for understanding who does what on your new data team.
| Model Type | Core Function | Real-World Ecommerce Example |
|---|---|---|
| Classification | Sorts data into predefined categories (e.g., Yes/No, High/Low Risk). | Identifying customers at high risk of churning in the next 90 days. |
| Regression | Predicts a continuous numerical value (e.g., revenue, quantity). | Forecasting the total sales revenue for the next financial quarter. |
| Clustering | Discovers natural, hidden groupings within the data. | Finding a new customer segment of “late-night luxury shoppers.” |
Together, these three models form the bedrock of most ecommerce predictive analytics strategies. By working in concert, they give you a rich, multi-dimensional view of where your business is headed and how you can steer it in the right direction.
The Data You Need for Accurate Predictions

Predictive models have an incredible amount of potential, but they all share the same vulnerability: they are only as good as the data you feed them. It helps to think of your data as fuel for a high-performance engine. Put in low-grade fuel, and you’ll get sputtering results and unreliable forecasts. For your prediction engine to run smoothly, you need a steady stream of clean, high-quality, and relevant information.
This data is what allows you to build a complete, multi-dimensional picture of your business. It captures not just what people buy, but who they are and how they shop. Get this foundation wrong, and even the most sophisticated algorithms will fall flat.
Transactional Data: The What and When
The absolute bedrock of any ecommerce predictive analytics strategy is your transactional data. This is the core ledger of your business, tracking every single purchase made through your store. It’s the raw, factual record of every sale.
This data gives you the hard answers about buying behaviour:
- Order History: What specific products did people buy?
- Order Value: What was the final dollar value of each order?
- Purchase Dates: When did the sale happen? This is crucial for spotting seasonality.
- Discount Codes: Were any promo codes or special offers applied?
By digging into this information, your models can start to pick up on foundational patterns, like which products are top sellers, when your busy seasons are, and how well your sales promotions are actually working.
Behavioural Data: The How and Why
If transactional data tells you what happened at the finish line, behavioural data reveals the entire story of how a customer got there. It follows every click, scroll, and search, painting a vivid picture of what a user is thinking and what they’re looking for.
This is where you graduate from just looking at sales figures to truly understanding the why behind a purchase. Seeing how people interact with your site is the key to predicting what they’ll do next.
A few key behavioural data points include:
- Pages Viewed: Which product pages or categories are getting the most attention?
- Time on Page: How long are they spending on a particular product’s page?
- Search Queries: What are they typing into your search bar?
- Cart Events: What items are they adding to their cart, and just as importantly, what are they removing?
This is the kind of information that helps a model differentiate between someone who’s “just looking” and a shopper who is moments away from buying, giving you a chance to step in at just the right time.
Customer Data: The Who
Finally, customer data is the glue that holds everything together. It adds context about the actual person behind all those clicks and purchases. This is where demographic and personal details help you create detailed customer profiles, making your predictions much more targeted and accurate.
Important customer data to track includes:
- Demographics: Basic info like age, gender, and geographic location.
- Contact Information: Email addresses and phone numbers.
- Acquisition Source: How did they find you in the first place? Was it a social media ad, a Google search, or something else?
- Customer Lifetime Value (CLV): A crucial calculation of a customer’s total projected worth to your business.
When you bring these three types of data together, i.e., transactional, behavioural, and customer, you create an incredibly powerful dataset. A huge part of this is knowing which metrics matter most, a central idea in the wider world of ecommerce analytics. You can dive deeper with our introduction to key ecommerce analytics metrics and KPIs in our guide. Once you have a firm handle on these data points, your predictive models have the premium fuel they need to drive real growth.
Putting Predictive Insights into Practice
Having a crystal ball that shows you what customers will do next is a massive advantage, but those insights don’t magically turn into revenue. The real power comes when you use those predictions to make smart, real-world decisions that directly grow your business. This is where the rubber meets the road.
The most successful online stores use ecommerce predictive analytics to do more than just see the future, they actively shape it. They weave these insights into the fabric of their daily operations, creating more relevant customer experiences, fine-tuning prices on the fly, and ultimately building stronger, more profitable relationships.
Let’s get into the specific strategies that transform predictive models from a neat tech feature into a core driver of growth.
Dynamic Pricing for Maximum Revenue
One of the most immediate ways to see a return is with dynamic pricing. Forget setting a price and leaving it for months. This approach adjusts your prices in real-time based on a whole host of factors. A predictive model can chew through data on current demand, what your competitors are charging, and even a single shopper’s behaviour to pinpoint the perfect price at that exact moment.
Think about it this way: a customer is browsing for a popular winter coat. The model might flag that demand is spiking in their city and nudge the price up slightly to maximize profit. On the flip side, if a product is losing steam, the model could drop the price to clear out stock before it goes out of season.
This isn’t about guesswork. It’s a precise, data-backed method for striking the perfect balance between sales volume and profitability, ensuring you’re not leaving money on the table.
Hyper-Personalized Recommendations
Your standard recommendation engine is pretty basic, often just showing what’s popular or what other people have bought. Predictive analytics blows that out of the water. By looking at a customer’s entire history, what they’ve clicked, what they’ve bought, and how often they visit, a predictive model can make an uncannily accurate guess about what they’ll want to buy next.
It’s the difference between a generic “you might also like…” and a recommendation so perfect it feels like you read their mind. For instance, the model sees a customer bought a high-end espresso machine three weeks ago. It can logically predict they’ll soon be looking for specialty coffee beans or a quality grinder and surface those exact items the next time they visit.
This level of foresight changes the shopping experience entirely. It stops being a simple transaction and becomes a helpful, guided journey. It proves you understand your customer’s needs, which is how you build real loyalty.
This proactive touch is absolutely critical in today’s market. After all, retail ecommerce is projected to account for 13.0% of all retail sales in Canada by 2025. With over 64.9% of Canadian smartphone users embracing mobile wallets for easy checkouts, personalizing their journey is how you win. A direct application of these models in driving revenue and improving lead scoring is detailed in this guide on predictive analytics for sales.
Proactive Churn Prevention
It’s a well-known fact: getting a new customer costs a lot more than keeping an existing one. Predictive analytics acts as your early-warning system, flagging customers who are about to leave before they actually walk out the door.
A classification model can be trained to spot the subtle red flags that signal a customer is losing interest:
- They’re buying less often than they used to.
- Their average order value is dropping.
- They’ve stopped opening your marketing emails.
- Their website visits have become less frequent.
As soon as the model flags a customer as “high risk,” you can automatically launch a retention campaign. This could be anything from a friendly “we miss you” email with a special discount, to showcasing new arrivals you know they’ll love, to simply asking for feedback.
By stepping in at just the right moment, you can re-engage these valuable customers and remind them why they loved shopping with you in the first place. To see how this fits into a bigger picture, take a look at our ultimate guide to ecommerce personalization.
Your Roadmap to Implementing Predictive Analytics
Jumping into ecommerce predictive analytics can feel like a massive undertaking, but it doesn’t have to be overwhelming. The secret is to see it as a series of manageable steps, not one giant leap. This roadmap breaks the whole journey down into a clear, actionable plan that will guide you from the drawing board to real-world results.
Whether you decide to go with an all-in-one software solution or build a custom model from scratch, following a structured approach keeps you on track. It prevents you from getting bogged down in the technical weeds.
Let’s walk through the five essential stages of a successful rollout.
Step 1: Start With Clear Business Goals
Before you even think about code or software demos, you need to know exactly what you’re trying to achieve. Predictive analytics is a powerful tool, but it’s useless if it isn’t aimed at a specific business problem. Vague goals like “we want to increase sales” just won’t cut it.
You have to get specific. Tie your objectives directly to key performance indicators (KPIs) that you can actually measure. A well-defined goal gives your models a clear target and provides a solid benchmark for tracking success.
Here are a few examples of strong, specific goals:
- Reduce customer churn by 15% in the next six months.
- Increase the average order value (AOV) by 10% by sharpening our product recommendations.
- Cut inventory carrying costs by 20% by getting our demand forecasting right.
- Boost marketing campaign conversion rates by 5% by finding high-intent customer segments.
Once you have these targets locked in, every step that follows has a clear purpose. This clarity is absolutely vital for getting your team on board and justifying the investment.
Step 2: Audit and Prepare Your Data
Like we’ve touched on, your predictive models are only as good as the data you feed them. This stage is probably the most critical and time-consuming part of the process, but there are no shortcuts here. It all starts with a thorough audit of your data sources to see what you’re working with, checking its quality, consistency, and completeness.
Think of it like cooking a gourmet meal. The best chef in the world can’t create a masterpiece with stale, mismatched ingredients. Your data needs to be clean, organized, and ready for your algorithms.
This process usually breaks down into three key actions:
- Consolidate: Pull all your data out of its silos. This means bringing information from your ecommerce platform, CRM, marketing tools, and analytics software into a single, unified place.
- Clean: Hunt down and fix errors, get rid of duplicate entries, and figure out how to handle any missing values. Bad data leads directly to bad predictions. It’s that simple.
- Structure: Get your data organized into a consistent format so your models can easily read and process it.
Step 3: Choose the Right Tools or Team
With clean data and clear goals, you can now decide how you’re going to do the analysis. For most ecommerce businesses, this choice boils down to two main paths: buy a ready-made solution or build your own.
An off-the-shelf software platform is often the fastest and most cost-effective way to get going. Many modern tools come with user-friendly interfaces and have built-in predictive features for common tasks like customer segmentation or inventory forecasting.
Building an in-house model gives you far more customization and control, but it’s a serious investment. You’ll need to hire specialized talent like data scientists and engineers. Your final decision will hinge on your budget, technical resources, and how complex the problems you’re trying to solve really are.
Step 4: Build and Test Your First Models
This is where the magic starts. My advice? Start small. Pick one of your business goals and focus on that. If reducing churn is your top priority, you’ll start by training a classification model on your historical customer data to spot the signs of an at-risk shopper.
This is an iterative process. You’ll build an initial model, test its predictions against a fresh set of data to see how accurate it is, and then tweak it. Don’t expect perfection on your first try. The aim is to create a model that is consistently more accurate than a simple educated guess.
Getting this right is crucial for staying competitive. The Canadian eCommerce market, valued at around USD 41.79 billion in 2025, is on track to hit USD 66.89 billion by 2030. To grab a piece of that pie, using analytics for demand forecasting and personalization isn’t just a nice-to-have; it’s essential. You can learn more about how AI is shaping the market by exploring these Canadian ecommerce industry insights.
Step 5: Deploy, Measure, and Iterate
Once your model has proven its worth, it’s time to put it to work. This means plugging its outputs directly into your day-to-day operations. For a churn model, this could mean automatically sending a personalized retention offer to any customer it flags as a high flight risk.
But you’re not done yet. The final step is to constantly monitor the model’s performance and measure its impact on that KPI you set way back in Step 1. Is your churn rate actually going down? Are your inventory forecasts getting more accurate?
This feedback loop is what makes the whole system work. It’s how you’ll continue to refine your models and, most importantly, prove their return on investment over time.
Common Questions About Predictive Analytics
Thinking about using ecommerce predictive analytics is exciting, but it’s totally normal to have questions about how it all works in the real world. Moving from a cool idea to a practical tool means figuring out new tech, understanding your data, and making some smart decisions. This section will give you straight-up answers to the most common questions we hear from business owners, helping you get a clear picture of what it really takes to get started.
We’ll cover everything from the skills you need on your team to the data you need in your systems, so you can move forward with confidence.
Do I Need a Data Scientist to Get Started?
This is usually the first question people ask, and the answer is a relief: not anymore. A few years ago, the answer would have been a definite yes. But things have changed.
While a data scientist is still a huge asset for building incredibly complex, custom prediction models from scratch, the barrier to entry has come way down. Many modern ecommerce platforms and third-party apps now come with powerful predictive analytics features built right in. You’ll find tools for inventory forecasting, customer segmentation, and marketing automation that are either part of the software you already use or available as simple, one-click integrations.
For most small and medium-sized businesses, these “plug-and-play” solutions are more than enough. They’re the perfect way to start tapping into predictive insights without the massive investment of hiring a dedicated data science team.
How Much Historical Data Do I Really Need?
There’s no magic number here, but a good rule of thumb is to aim for at least a full year of clean, reliable data. Why a year? Because that gives the models enough information to learn your unique business rhythms, including those all-important seasonal trends and annual customer habits.
But here’s the most important part: quality is far more important than quantity. Seriously. Six months of accurate, well-organised data is infinitely more valuable than five years of messy, inconsistent records. If your data is a mess, your predictions will be, too. It’s that simple.
Before you even think about volume, focus on getting your data collection right. A smaller, cleaner dataset will always beat a massive, chaotic one when you need predictions you can actually trust.
Nailing down your data quality first will pay off big time down the road.
What is the Difference Between Predictive Analytics and BI?
It’s easy to get these two mixed up since they both revolve around data, but they do fundamentally different jobs. I find a simple driving analogy works best to clear this up.
Business Intelligence (BI) is like looking in your rearview mirror. It takes all your past data and organizes it into dashboards and reports to show you exactly what has already happened. It’s perfect for answering questions like, “What were our total sales last quarter?” or “Which marketing channel performed best last month?” BI is all about describing the past.
Ecommerce predictive analytics, on the other hand, is your GPS. It uses that same historical data to forecast what’s coming up on the road ahead. It helps you answer forward-looking questions like, “What are our projected sales for the next quarter?” or “Which customers are most likely to buy from our next campaign?”
So, in short: BI helps you understand what happened, while predictive analytics helps you influence what happens next.
How can We Measure the ROI of This Technology?
Measuring the return on your investment in predictive analytics isn’t guesswork; it just requires a bit of discipline. The trick is to tie every single initiative to a specific, measurable business goal. If you don’t, you’re just playing with interesting tech. If you do, you’re actively driving growth.
The process is pretty straightforward: set a goal, use a predictive strategy to achieve it, and then track the heck out of the relevant metric.
Here’s what that looks like in practice:
- Customer Churn Prediction: You use a model to flag at-risk customers and launch a retention campaign. To measure ROI, you’ll track the decrease in your churn rate and the resulting increase in average customer lifetime value (CLV).
- Inventory Forecasting: You implement demand forecasting to manage stock levels. Your key metrics are the reduction in stockouts and backorders, plus the decrease in inventory carrying costs because you’re not overstocking.
- Personalized Marketing: You run campaigns using predictive segments. You measure success by tracking the lift in conversion rates and the increase in average order value (AOV) compared to your standard, non-personalized campaigns.
By setting clear goals from the start and consistently tracking these core business numbers, you can draw a straight line from your investment to your bottom line. It becomes incredibly easy to prove its worth.
Ready to turn your data into your most powerful asset? Cleffex Digital Ltd builds innovative software solutions that help businesses like yours harness the power of AI and predictive analytics to drive growth. Discover how our agile approach can solve your biggest challenges at https://www.cleffex.com.


