


96.8% of Canadian family physicians used electronic medical records in 2024, according to Health Canada's 2024-25 Departmental Results Report. That figure sounds like a connected system. It isn't, on its own. A record can sit inside one clinic while a referral, a bed request or a discharge still moves by phone and memory. A good healthcare operations dashboard closes that gap. It shows demand, queues and remaining capacity together, in plain language, so managers can act before the next shift rather than explain the last one.
Why One Wait Time Is Not an Operations Picture
Say it's 7 a.m. in a busy emergency department. The charge nurse sees a full waiting room. The bed manager sees three wards with no staffed beds. An executive, looking at yesterday's pack, sees one average wait that looks almost normal. All three are looking at the same morning, and only the executive's view is misleading.
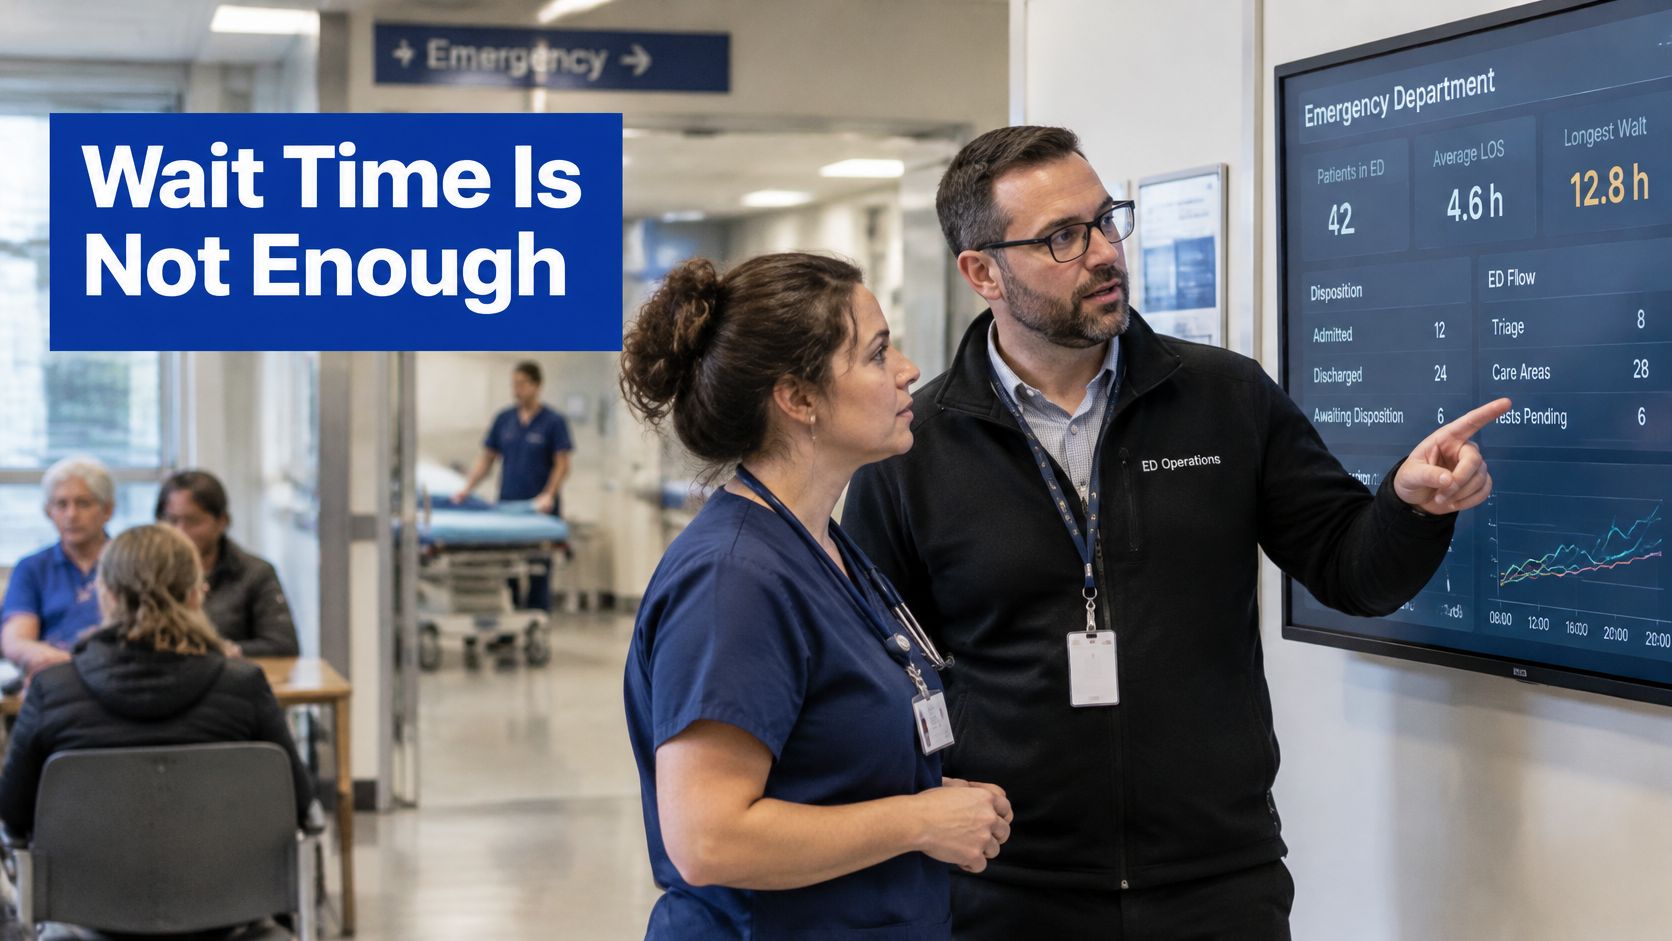
A healthcare operations dashboard is one shared view of demand, acuity, throughput and remaining capacity. It isn't a clinical chart, and it isn't a finance pack. Think of an airport departures board. A late flight only makes sense beside the gate, the crew and the inbound aircraft. On its own, "delayed" tells you nothing you can fix.
What a single average hides
A calm median can hide a long tail of patients who waited far longer. An emergency delay can also turn out to be a full ward downstream, which means adding triage staff won't move anyone. That's the trap of publishing one wait time. You've described a symptom and hidden its cause.
The same facts serve different people. A charge nurse, a bed manager, a clinic administrator and an executive each need a different slice, but they shouldn't argue about whose numbers are right.
What follows gives you three things. A Canadian indicator set you can put on screen now. Rules for joining systems so healthcare KPI tracking stays comparable across sites. And a staged way to build, one flow at a time.
Canadian Flow Indicators Worth Putting on Screen
Canadian emergency flow indicators for a 2026 operations dashboard
| Indicator | Clock or definition | 2024-2025 figure | Use on the dashboard |
|---|---|---|---|
| Emergency visits | NACRS-reported visits | 16.1 million, about 89% of Canadian ED visits | Set the volume baseline |
| Ambulance arrivals | Share arriving by ambulance | About 17% | Show inflow mix |
| Left without being seen | Left before seeing a physician | 7.7% | Flag access failure |
| Admissions from ED | Saw a physician, then admitted | 12%, about 1.8 million people | Forecast ward demand |
| Total ED stay, shorter half | Time in the emergency department | Half spent 4 hours or less | Judge ordinary throughput |
| Total ED stay, middle band | Time in the emergency department | More than one-third spent 5 to 14 hours | Show growing complexity |
| Total ED stay, long tail | Time in the emergency department | 10% spent more than 14 hours; share up 28% vs 2018-2019 | Surface extreme stays |
| Time to physician, typical | Wait for physician assessment | Half waited just under 2 hours; 10% more than 5 hours | Separate assessment delay |
| CTAS 1-2 assessment | 90th percentile, resuscitation and emergent | 4.3 hours; median 1.1 hours | Protect the sickest patients |
| CTAS 3 assessment | 90th percentile, urgent | 5.8 hours; median 1.8 hours | Show urgent-queue pressure |
| CTAS 4-5 assessment | 90th percentile, less or non-urgent | 5.9 hours; median 1.8 hours | Avoid hiding lower-acuity waits |
| Bed wait, shorter half | Admit decision to leave for a bed or theatre | Half waited under 5 hours | Separate boarding from ED care |
| Bed wait, long tail | Same admit-to-departure clock | 10% waited more than 36 hours | Expose severe boarding |
| Urban bed-wait tail | 90th percentile, large urban hospitals | 40.8 hours, up from 27.6 hours in 2018-2019 | Compare large sites over time |
| Rural bed-wait tail | 90th percentile, medium rural or remote hospitals | 34.6 hours | Stop treating all hospitals as one queue |
The table follows the patient's path. The Canadian Institute for Health Information's emergency department analysis reported 16.1 million emergency-department visits through the National Ambulatory Care Reporting System in 2024-2025, representing approximately 89% of all emergency-department visits in Canada. In that same reporting, about 17% of patients arrived by ambulance, 7.7% left before seeing a physician, and 12% of patients who saw a physician were admitted to hospital, approximately 1.8 million people.
Two clocks, not one
Here's where readers often get confused. Total ED stay and bed wait are different clocks. Total stay covers the whole visit. The bed wait starts at the decision to admit and ends when the patient leaves the department for an inpatient bed or operating room, as set out in CIHI's indicator definition for Emergency Department Wait Time for Inpatient Bed, where the 50th percentile represents the maximum wait experienced by half of admitted patients and the 90th percentile represents the maximum wait experienced by 90% of admitted patients.
Practical rule: If a tile doesn't say when its clock starts and stops, don't publish it. Two teams will read it as two different problems.
Percentiles matter because averages flatten the tail. In 2024-2025, 10% of patients spent more than 14 hours in the emergency department, and that share increased by 28% compared with 2018-2019, while the 90th-percentile wait for an inpatient bed at large urban hospitals was 40.8 hours, compared with 34.6 hours at medium rural or remote hospitals, according to CIHI's analysis of longer ED stays. Note the urban rise clearly. From 27.6 hours to 40.8 hours is a rise of roughly 48%.
Filter physician assessment by acuity as well. CIHI's acuity analysis reported a 90th-percentile wait of 4.3 hours for CTAS levels 1-2, 5.8 hours for CTAS level 3 and 5.9 hours for CTAS levels 4-5 in 2024-2025. Resuscitation patients and less urgent patients aren't in the same queue, so don't chart them as one.
Together, these tiles tell you where delay sits, inside the department or in downstream beds. Other services should copy the pattern, volume, queue age and capacity, rather than inventing vague labels such as average waiting time.
Joining Systems and Staging the Build
Access is not exchange: That's the single most important idea in this guide, and it's where most dashboard projects fail.
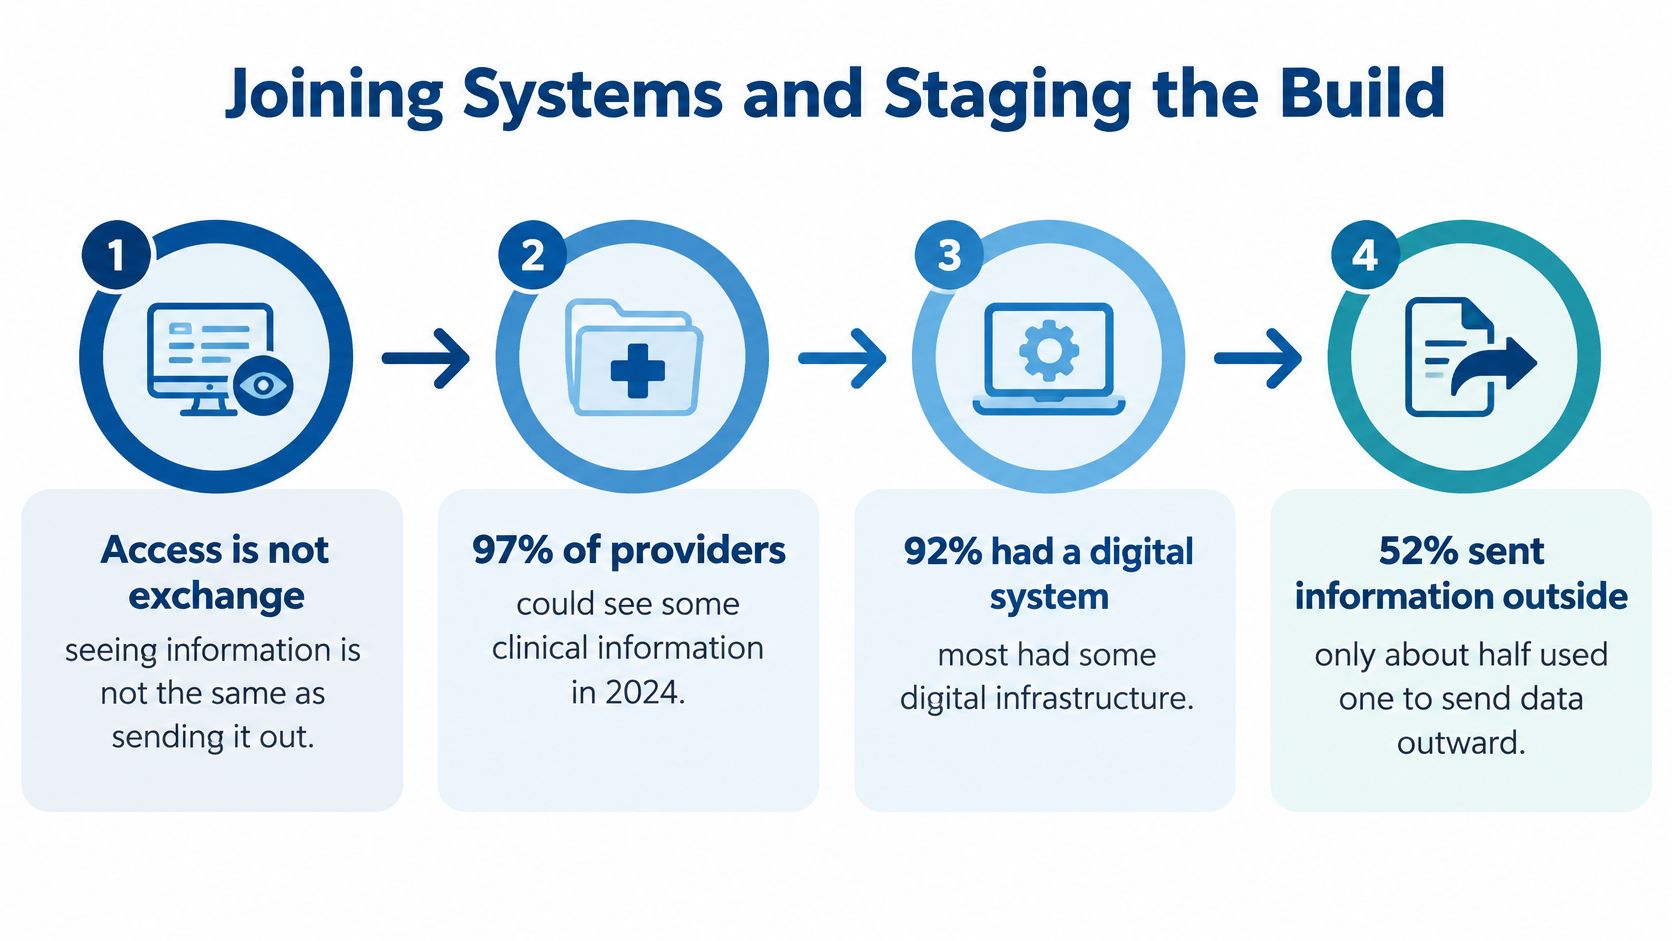
Statistics Canada's 2025 Survey on the Use of Digital Technologies by Health Care Providers found that in 2024, 97% of Canadian health-care providers had access to some form of patient clinical information and 92% had access to a digital health system. Yet only 52% of providers with access to clinical information used a digital system to send or share that information electronically with providers outside their main practice, and 78% reported at least one barrier to external information sharing.
Where Canadian clinical sharing still stalls
| Condition | Share of providers | What the dashboard should show |
|---|---|---|
| Access to some patient clinical information | 97% | Do not treat access as proof of exchange |
| Access to a digital health system | 92% | Separate adoption from operations |
| Used a digital system to share outside the main practice | 52% | Track completed external exchange |
| At least one barrier to external sharing | 78% | Count friction, not just logins |
| Insufficient integration between systems | 50% | Flag interface gaps by partner |
| System cannot send information to outside providers | 46% | Show destinations that are unreachable |
| Time-consuming or multiple sign-ins | 22% | Surface access friction for staff |
So your healthcare analytics dashboard has to do more than draw charts. It has to reconcile systems that were never designed to agree, and it has to show where sharing breaks. Otherwise, you're decorating a gap.
Build the pipeline in one order
Start with source systems: the EMR, hospital information system, bed board, theatre list, and laboratory and imaging milestones. Then resolve identity and terminology, so the same patient and the same term mean the same thing everywhere. Then land everything in a canonical model carrying encounter and facility identifiers, timestamps and data-quality flags. Then build a validated metric layer. Only then draw the role screen.
CIHI's data standards guidance states that interoperability requires systems to both exchange data and preserve its meaning for users, and its standards cover HL7 v2/v3, CDA, FHIR, JSON and XML. Treat those as formats to parse at ingestion, not as a finished model. Use CIHI's Canadian Core Data for Interoperability as your reference for the shared minimum elements, since it defines a minimum standardised set intended for meaningful exchange across the Canadian care continuum.
Before anyone colours a chart, write down each indicator's numerator, denominator, inclusion rules, refresh latency, small-cell suppression rule and data owner. If that page doesn't exist, the tile isn't ready. Our own delivery practice follows the same discipline. We define clear KPIs at the start of a project, show progress through dashboards and sprint reviews, and keep aligning development with business goals to track return on investment. Teams working through the plumbing can also use our practical guide to healthcare data integration for the field-level detail.
Seven stages, in sequence
Pick one constrained flow: Choose emergency boarding or clinic referrals, and name its decision owner.
Write the metric specification: Define it against the canonical model, not a local EHR label.
Inventory the gaps: List fields that are missing, duplicated or not shareable outside the site.
Build ingestion for that flow only: Add identity matching and put quality flags beside the first tiles.
Release a narrow view: Check that a red tile triggers real action, and log every false alarm.
Add the next flow later: Wait until definitions hold for a full reporting period.
Review monthly: Reset targets and retire tiles nobody acts on.
Resist stage skipping. A wide first release feels ambitious and usually produces numbers nobody trusts.
What Each Role Needs from the Same Feed
One feed, several screens. The mistake is building one wallboard and expecting everyone to love it.
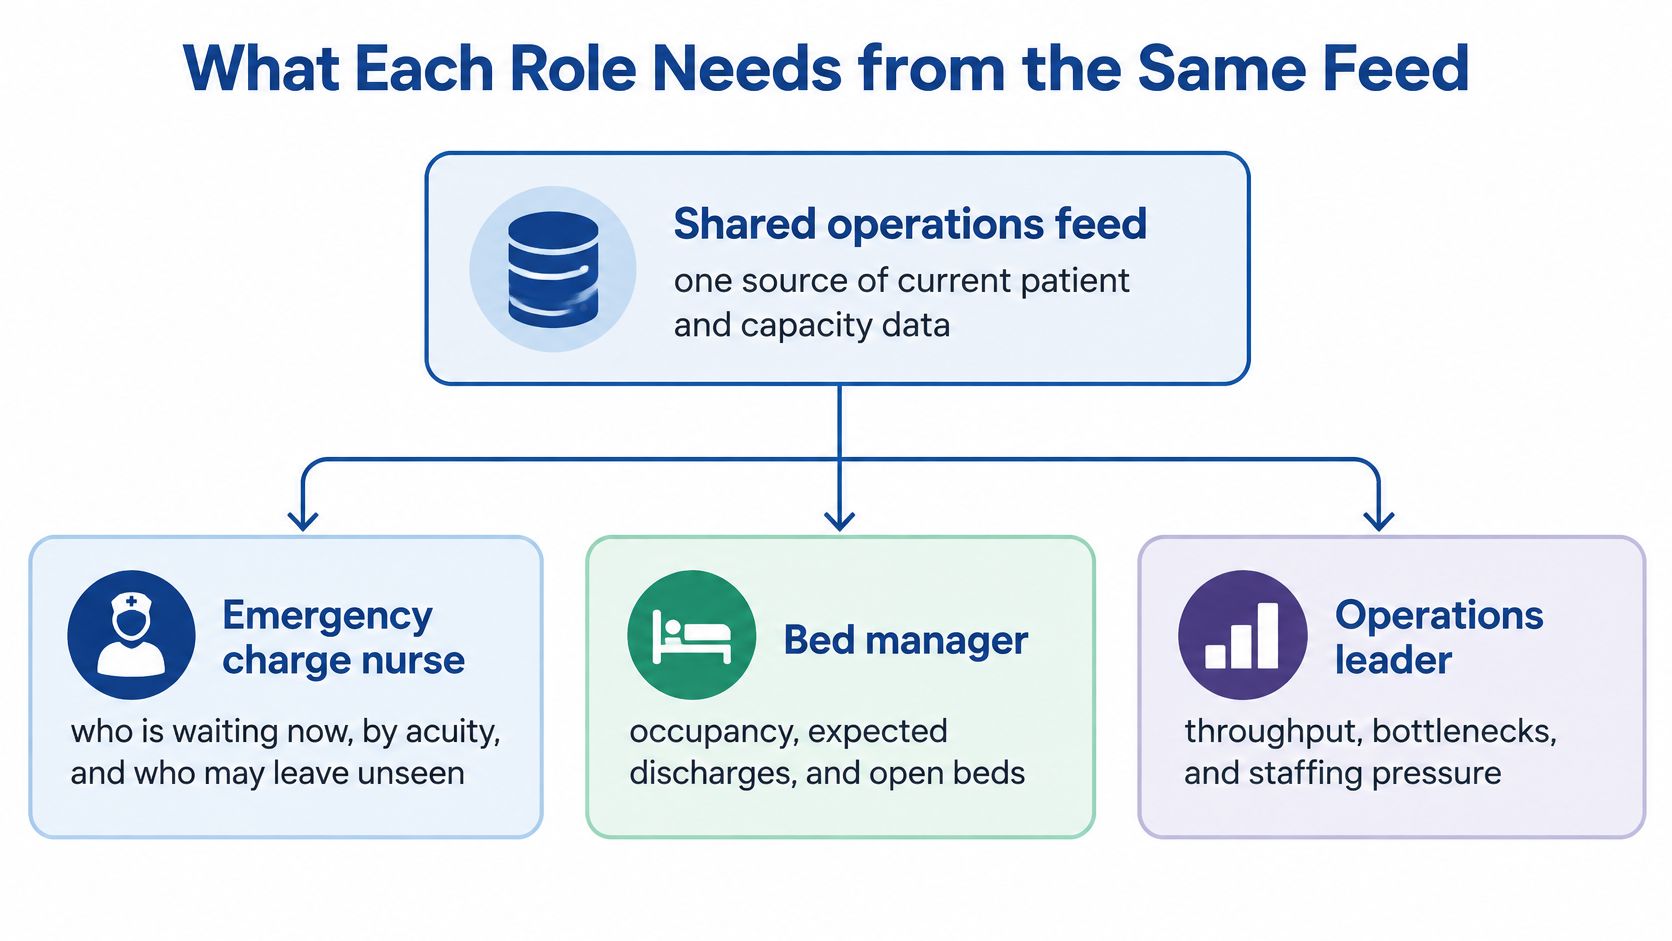
Start from the decision, not the job title. The emergency charge nurse asks who is waiting now, by acuity, and who is close to leaving unseen. That view needs a short time window and a live queue. Anything about monthly cost per case is noise at that moment.
The bed manager asks a different question. What's our occupancy, which discharges are expected, how old is the admission queue, and is this delay a missing bed or a slow assessment? Those two causes need opposite responses, so the screen has to separate them.
Beyond the emergency department
A perioperative lead watches turnover time, backlog and cancellations against staffed capacity. A list can look full and still be unworkable if recovery beds aren't there. Capacity, not volume, is the honest denominator.
A clinic manager rarely needs bed occupancy. Referral age, unconfirmed handoffs, inbox volume and documentation spilling after hours matter more. Community teams feel a broken handoff as a patient who never arrives, so transfer status belongs at the top of their screen.
An executive needs the opposite of detail. A short set of exceptions against target, with the accountable owner named, beats a wall of patient rows. Too much granularity at that level invites corridor decisions based on one unusual case.
Underneath all of these sits one shared layer of hospital operations analytics, so the nurse and the executive are arguing from identical facts. Each view still has to state its question, its time window and its action owner on the screen itself.
If the person looking at a tile can't name the action they'd take when it turns red, that tile doesn't belong on their screen.
Apply that test ruthlessly. It removes most decorative tiles in one pass, and it stops a finance ratio from landing on a nursing view where it will be ignored.
Design Rules That Stop Stale Data From Looking Calm
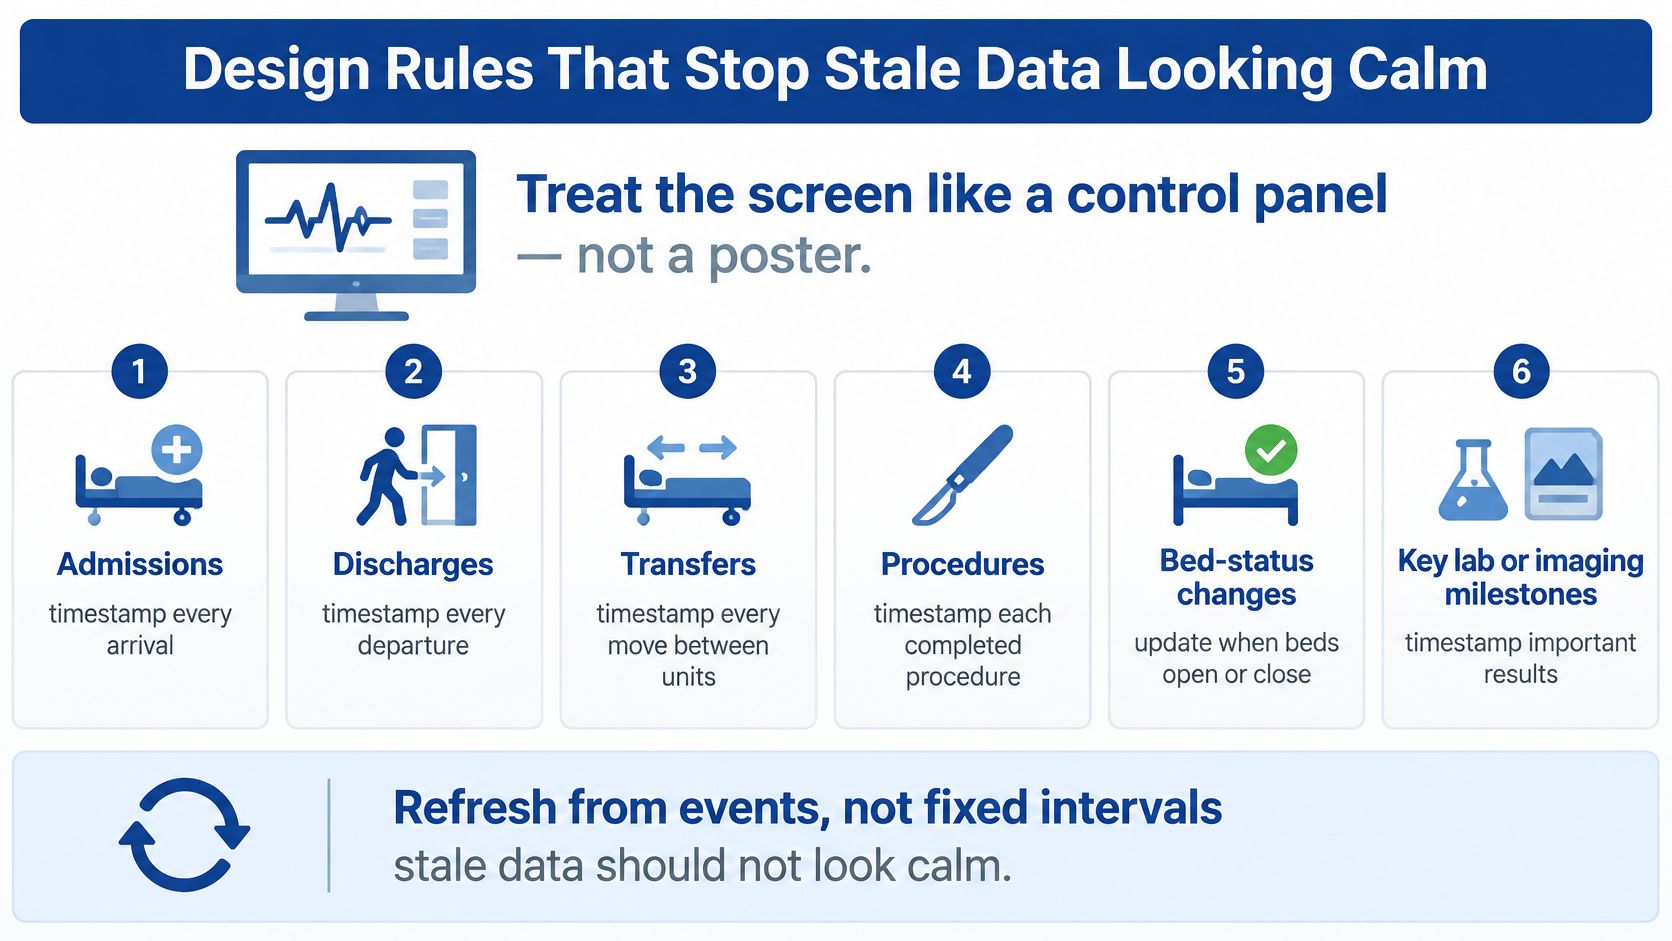
A ward looks stable all morning. Occupancy is flat, no alerts, nothing red. Then someone notices last night's discharge file never arrived. The ward wasn't calm. The data was old. This is the most common dashboard failure, and it's a design fault, not a user fault.
Capture events, not snapshots
Record admissions, discharges, transfers, procedures, bed-status changes and key laboratory or imaging milestones as timestamped events. Then derive occupancy, turnover time, queue age, transfer dwell time and demand-versus-capacity variance from those events. CIHI's work on strengthening Canada's health information systems supports this direction, describing system-level data as a basis for monitoring, planning and shorter waits, and citing Ontario's Project AMPLIFI as supporting more than 150,000 secure hospital-to-long-term-care patient transfers.
Every tile must show event time separately from ingestion time, plus freshness, missingness and whether sources have reconciled. If a feed is late, say so on the tile. A grey "data delayed" state is far safer than a green tick built on silence.
Escalate against a baseline
Colour alone explains nothing. Compare each value with its service target and with a rolling baseline for that day and hour, then route the exception to a named team. Tuesday at 9 a.m. is not Sunday at 3 a.m., and your thresholds shouldn't pretend otherwise. Our guide to healthcare data visualisation covers how to make those comparisons legible at a glance.
Match speed to the decision. Use real-time healthcare data where the action is immediate, such as bed status or an ambulance inbound. Use a validated daily figure where the decision is tomorrow's staffing. Faster isn't automatically better. Unvalidated fast data creates arguments.
Privacy is a design constraint, not a final review step. Apply least-privilege access, keep audit logs, aggregate when cell sizes are small, and keep identifiable clinical detail apart from management KPIs. Where a deployment crosses into GDPR or HIPAA territory, we build to those expectations with strong encryption, secure data storage, anonymisation techniques and access control measures. Most Canadian deployments won't, so design for the rules you face.
Three things to avoid:
No unidentified averages: Every figure names its clock, period and percentile.
No green status on incomplete data: Missing feeds show as unknown, never as fine.
No patient names on an executive wall: Identifiable detail stays behind a logged drill-down.
Situations Where the Split in the Numbers Matters
A large urban emergency department watches total stay climb week after week. The instinct is to add triage nurses. Splitting the clocks shows assessment times are steady while the bed-wait tail is growing, so priority shifts to discharge timing and ward capacity. Without the split, you'd have hired into the wrong queue. For the capacity side of that fix, see our notes on healthcare capacity management.
Contrast a medium rural site. Its bed-wait tail is shorter, but external sharing fails more often, so patients stall at the handoff rather than at the ward door. Another local chart won't help. Fixing the transfer will.
A clinic reports strong digital adoption while referrals sit unconfirmed. Login counts declare success. Referral age, the share of referrals with no status, and failed exchanges tell the truth. Those three tiles are worth more than a usage graph.
Then there's the workload nobody charts. CIHI's reporting on family doctors' well-being states that Canadian family doctors report spending a median 20% of their weekly time on administrative tasks, compared with 17% among international peers. A dashboard that only counts completed transactions can hide work pushed onto nurses, pharmacists or patients. Pair any automation claim with minutes per encounter, after-hours documentation, unanswered messages and abandoned follow-up, split by role and by urban versus rural setting where the data allow.
Hospital teams coordinating many patients in one meeting need the same discipline, timestamped preparation rather than a slideshow of stale scans. Our MDT app work improved the ability to prepare for meetings involving 20 to 30 patients by putting scans, diagnoses and treatment history in one centralised view.
The test is simple. A better number changes who acts before the next shift. A worse one just looks busy in a quarterly pack.
Proving the Dashboard Changed a Decision
Usage statistics prove nothing. A dashboard can be opened every morning and still change nothing. So measure decisions.
Set the comparison before you launch
Choose a before-and-after window with at least one full reporting period on each side. Record a baseline for the measures your tiles are meant to move, such as the 90th-percentile bed wait, boarding minutes and referral age. Without a baseline, every later improvement is a story rather than evidence.
Then log the behaviour. For each red tile, record the action taken, the accountable owner and the time from alert to action. Review that log weekly with the people who received the alerts, not just the people who built them.
Count the false alarms honestly
Track false alarms every week. If you're seeing more than a handful a month, you have a threshold problem, not a training problem. Staff stop trusting a board that cries wolf, and rebuilding that trust takes far longer than fixing a threshold.
Look for queue movement: A shorter bed-wait tail after discharge changes is evidence.
Ignore chart views: Opens and clicks measure curiosity, not outcomes.
Check who absorbed the work: If flow improves while nurses take on unrecorded tasks, the gain isn't real.
Stratify the result: Compare by site and by urban or rural setting before claiming success.
Add a short staff pulse on workload alongside the numbers. It takes minutes, and it catches the invisible cost that a throughput chart will never show. Report results to operators in plain language, with the as-of time printed beside each figure so nobody quotes a stale number in a meeting.
A tile that has never changed a decision is decoration, however accurate it is.
If no decision has changed after two review cycles, narrow the tile set or redefine the metric. Don't add another department to a board that isn't yet earning its place.
Frequently Asked Questions
How fresh is real-time?
Use seconds or minutes only for bed status, ambulance arrivals and patients about to breach a wait target. Use a validated hourly or daily feed for length-of-stay percentiles and referral outcomes. Always print the as-of time on the tile.
Can one dashboard serve a clinic and a hospital?
Yes, if the canonical definitions match and the screens differ. Clinics emphasise referral and inbox burden. Hospitals emphasise beds, theatres and emergency flow. Shared definitions, separate views.
How should small sites handle privacy?
Aggregate small cells so individuals can't be identified from a count. Keep names off management views. Log who opened an identifiable drill-down, and review that log.
What should the first release contain?
One flow, five to seven tiles, a written specification for each, and a named owner for red exceptions. Start with the queue that currently surprises the morning huddle, not with every department.
If your organisation needs help joining regulated systems and defining those KPIs, Cleffex works with North American health teams on exactly that. We provide healthcare software integration for North American healthtech companies, enabling hospital connectivity, compliance, AI diagnostics and scalable platforms, and the healthcare software integration service sets out the scope. We also prioritise compliance with global standards such as GDPR and HIPAA where they apply, using encryption, secure storage, anonymisation and access control.
A trusted narrow board beats a complete board nobody believes.
If you're ready to replace a monthly pack with a board your charge nurses and bed managers trust, Cleffex Digital Ltd can help you define the KPIs, join your clinical and administrative systems, and release a narrow first view with a named owner for every red tile. Visit us to talk through your most constrained flow and what a first release would need to prove.