

Sustained hospital occupancy above 85% critically compromises safety and efficiency, making effective healthcare capacity management vital for system resilience. Canada's acute-care occupancy reached 86.7% in 2021, while the OECD average was 69.8%, leaving hospitals with little room to absorb sudden demand.
That gap changes how leaders should think about capacity. A hospital can have beds on paper yet lack usable capacity because beds are occupied, unstaffed, awaiting cleaning, blocked by delayed discharges, or unsuitable for the next patient. Healthcare capacity management is the disciplined coordination of beds, staff, rooms, equipment, admissions, care progression, and discharge so that patients reach the right setting without avoidable delay.
The technology matters, but it isn't the starting point. Leaders first need to understand where flow breaks, which signals arrive too late, and how clinical and operational teams can act from the same information.
The Critical Importance of Capacity Management
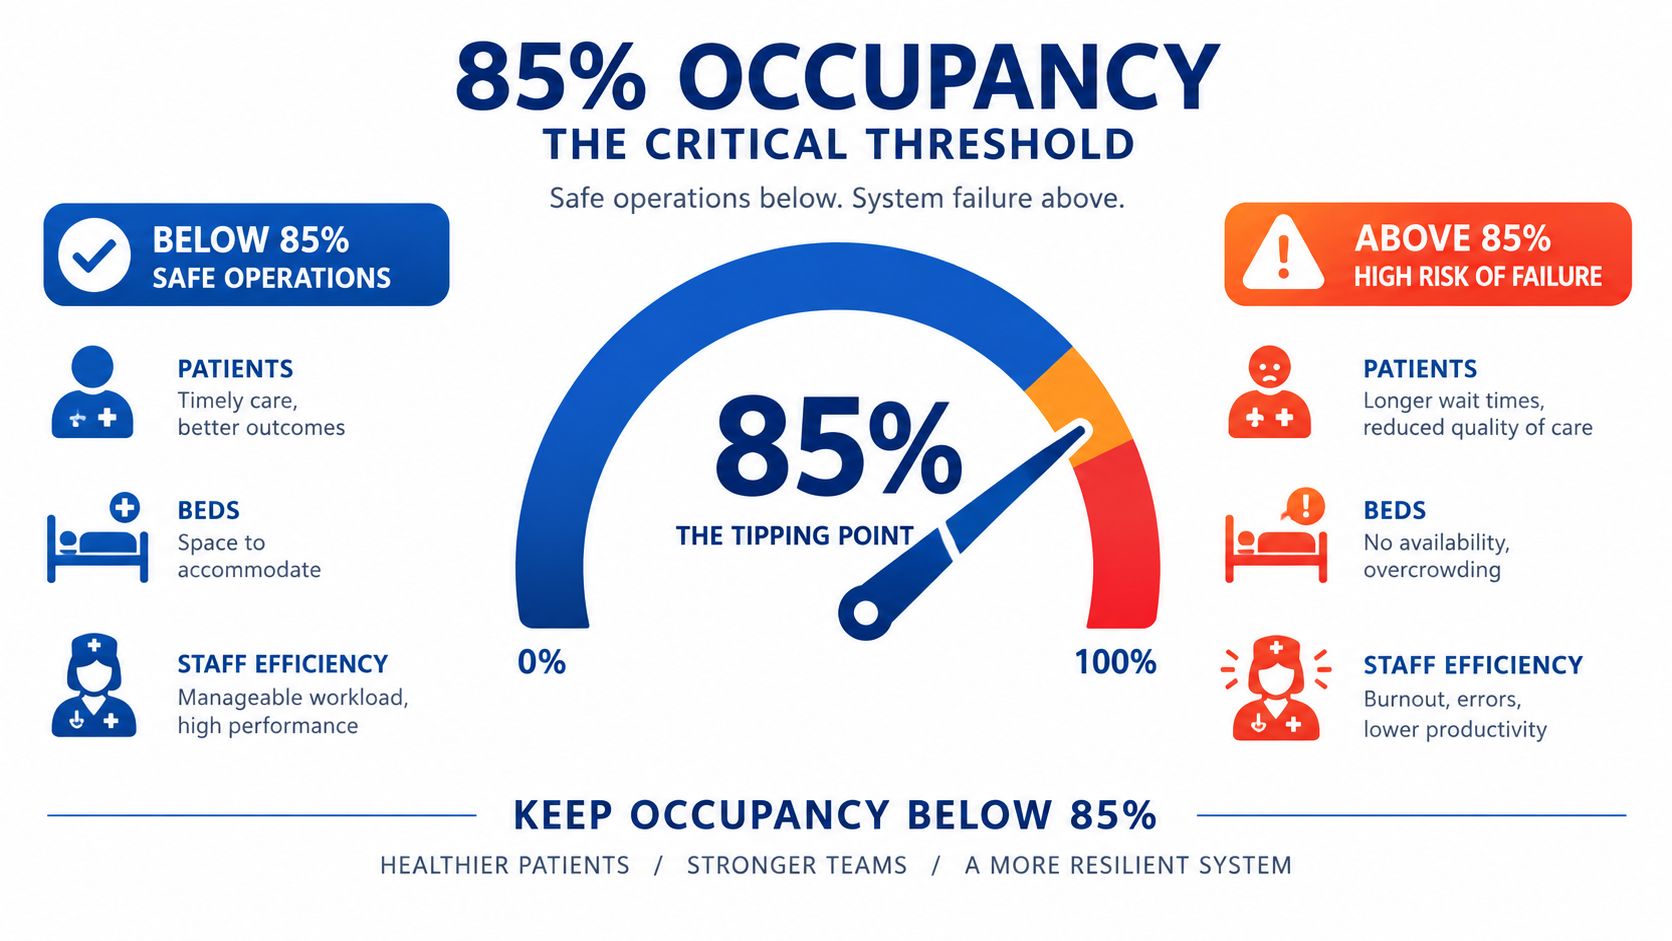
The 85% acute-care occupancy threshold is a practical warning line for hospital operations. Canadian hospitals were reported at 86.7% occupancy in 2021, ranking second-highest among 31 OECD countries, according to the Canadian Association of Emergency Physicians' position statement on emergency-department overcrowding. A separate C.D. Howe analysis found that Canada was one of only three OECD countries above 85% occupancy, compared with an OECD average of 69.8% in the same year, as reported in that source.
Occupancy isn't solely a finance or estate metric. Once a hospital operates above the threshold for sustained periods, the buffer that protects daily operations disappears. A late discharge, an unexpected admission, or a temporary staffing constraint can then create a chain reaction across the emergency department, inpatient units, diagnostics, transport, and community services.
Capacity is more than bed count
A bed becomes operational capacity only when the organisation can safely use it. That requires the right staff, equipment, infection-control status, ward capability, and patient placement decision. A vacant bed in a ward without appropriate clinical cover doesn't solve an emergency-department queue.
Ontario illustrates the pressure. The Ontario Hospital Association's 2025 analysis reports roughly 36,000 total hospital beds in March 2025, with about 65% acute-care beds, alongside a record average of 1,514 people waiting at 8:00 a.m. for an inpatient bed in January 2025. These conditions make small delays operationally significant.
Practical rule: Manage the whole patient journey, not just the number of occupied beds.
Healthcare capacity management therefore connects demand forecasting with hospital resource management. It asks whether the organisation can receive, assess, admit, treat, transfer, and discharge patients at the pace demand requires. That perspective shifts attention from crisis response to resilience, because the most valuable capacity may be released through better flow rather than new construction.
Core Metrics for Optimising Patient Flow
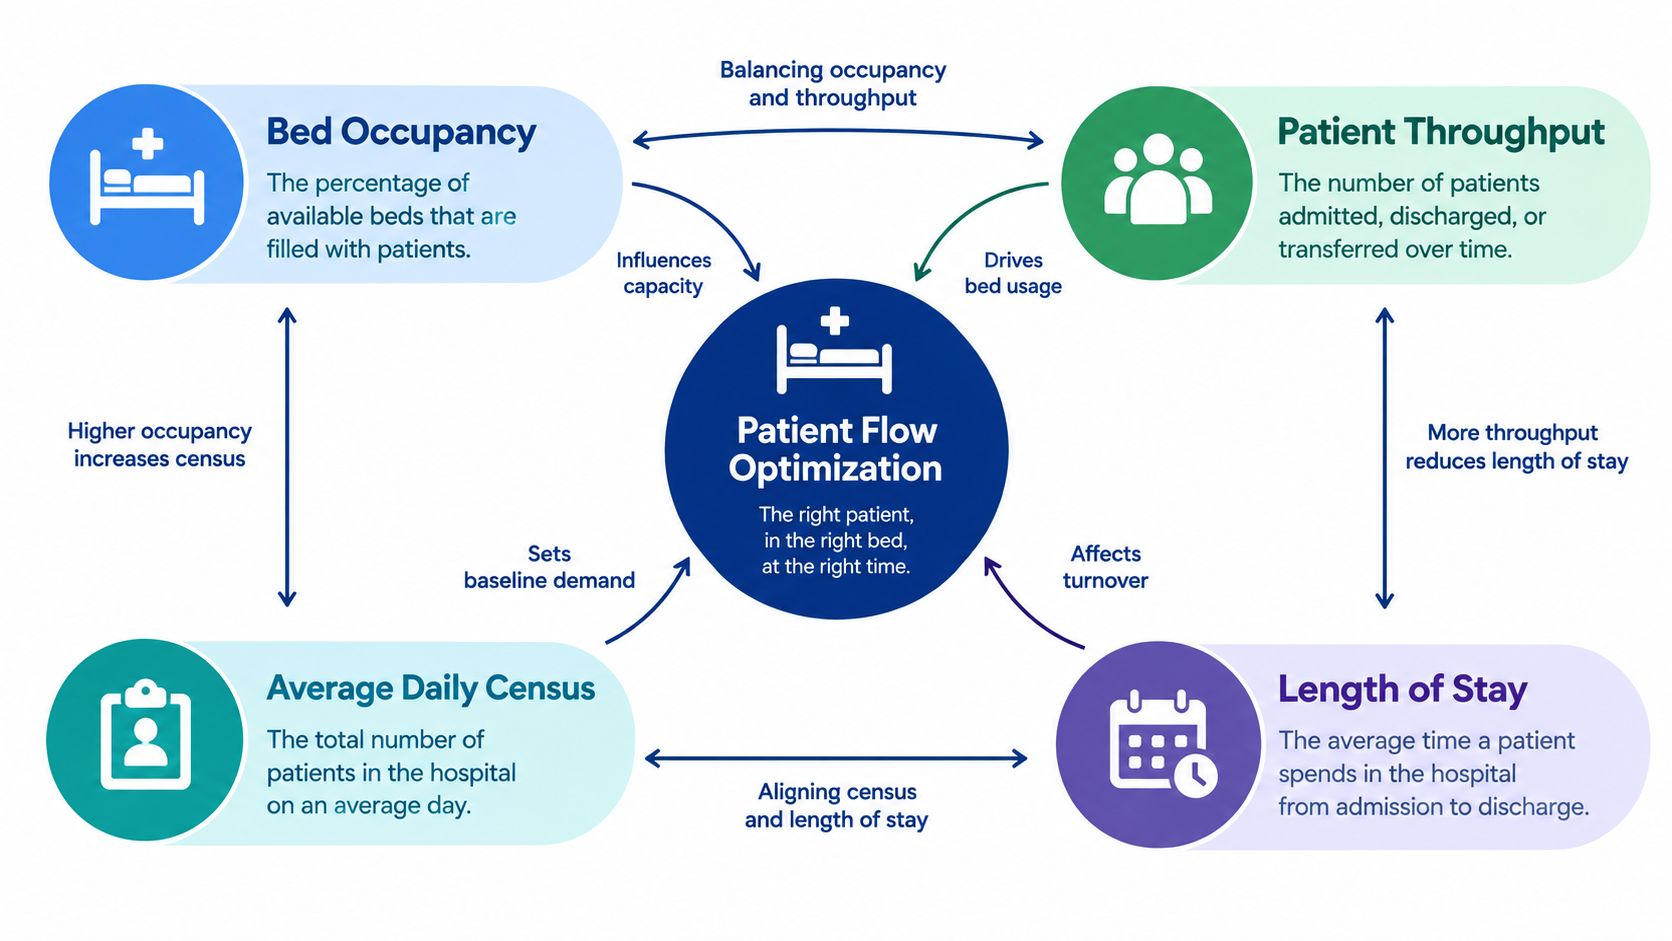
Four measures give leaders a practical vocabulary for patient flow: bed occupancy, patient throughput, length of stay, and surge capacity. They describe different parts of the same system. Used together, they show whether a hospital is full because demand is unusually high, because patients are staying longer than necessary, or because discharge and placement processes are restricting turnover.
Bed occupancy shows the remaining buffer
Bed occupancy measures how much inpatient capacity is in use. High occupancy can indicate strong demand, but it also reduces the organisation's ability to absorb variation. Leaders should examine occupancy by ward, speciality, patient type, and time period rather than rely on one hospital-wide figure.
Average daily census adds context by showing how many patients are present over time. A ward can have acceptable average occupancy but still experience predictable peaks that overwhelm staff or create temporary boarding.
Throughput measures movement
Patient throughput is the rate at which patients move through assessment, treatment, admission, transfer, and discharge. Faster movement isn't automatically better. Safe throughput means reducing avoidable waiting while preserving clinical decision-making, handover quality, and appropriate placement.
Length of stay, or LOS, is one of the strongest flow levers. When teams identify discharge barriers earlier, coordinate tests, and arrange post-acute support promptly, patients can move to the next appropriate setting. That releases capacity for new admissions without adding a bed.
Surge capacity is a readiness measure
Surge capacity is the ability to accommodate demand above normal operating conditions. It includes physical space, staff availability, equipment, escalation processes, and partnerships with community and post-acute services. A plan that counts extra beds but doesn't identify who will staff them isn't a complete surge plan.
| Metric | What it reveals | Operational question |
|---|---|---|
| Bed occupancy | Remaining inpatient buffer | Which beds are genuinely usable? |
| Patient throughput | Movement through the system | Where are patients waiting longest? |
| LOS | Time patients remain in care | What barriers are delaying progression? |
| Surge capacity | Ability to absorb variation | Which resources can be activated safely? |
Outpatient flow matters too. Better medical appointment scheduling can reduce avoidable congestion around clinics, diagnostics, and specialist pathways, helping organisations coordinate demand beyond the inpatient setting.
Strategies for Proactive Demand Forecasting
Reactive staffing asks, “What is happening now, and who can we move?” Proactive forecasting asks, “What demand is likely to arrive, and what must be ready before it does?” That time difference gives leaders more options, especially when emergency department boarding or delayed discharges are already restricting bed flow.
A useful forecast combines historical activity, seasonal patterns, scheduled procedures, referral information, transfer requests, and current operational conditions. A practical model might compare emergency department arrivals by hour with scheduled surgical blocks, current boarding counts, and expected discharges to estimate bed requests over the next 12 hours. The result should support clinical judgement, not replace it. Bed managers, nurse leaders, emergency physicians, and executives can then work from the same view of pressure points.
Reaction versus preparation
| Reactive model | Proactive model |
|---|---|
| Adds cover after queues form | Aligns resources before predicted pressure |
| Relies heavily on local intuition | Combines operational data with staff expertise |
| Escalates one problem at a time | Shows how ED, beds, staffing, and discharge interact |
| Measures yesterday's performance | Monitors leading signals and upcoming constraints |
Forecasting matters only when it changes a decision. A predicted rise in admissions might prompt earlier discharge coordination, revised theatre sequencing, targeted staffing, or a review of patients awaiting transfer. If the forecast remains in a report without an accountable owner, it will not relieve a queue.
For buyers assessing predictive analytics in healthcare operations, the important question is how the system produces and applies its forecast. Ask whether it can combine time-based arrival patterns with live boarding and bed data, show which signals drive a prediction, refresh the forecast as conditions change, and route recommendations to the teams responsible for action.
Build forecasts around operational rhythms
Daily bed huddles, shift planning, multidisciplinary rounds, and discharge reviews provide natural points for using forecasts. The system should show what changed, which constraint requires attention, and who owns the next action.
Intuition remains valuable when data are incomplete or clinical conditions change quickly. Teams make better judgements when they can test experience against a shared operational picture. Forecasting shifts capacity management from firefighting to earlier preparation.
Technology Enablers in Modern Healthcare Operations
Modern healthcare operations technology should act like a control tower. It doesn't move every patient or make every clinical decision. It brings together the signals that help authorised teams decide where capacity exists, where demand is building, and which action will relieve pressure safely.
The foundation is integrated EHR and bed-management data. EHRs remain essential records, but capacity decisions often require information from staffing systems, theatre schedules, emergency-department tracking, housekeeping, transport, discharge planning, and community services. Integration turns fragmented records into an operational view.
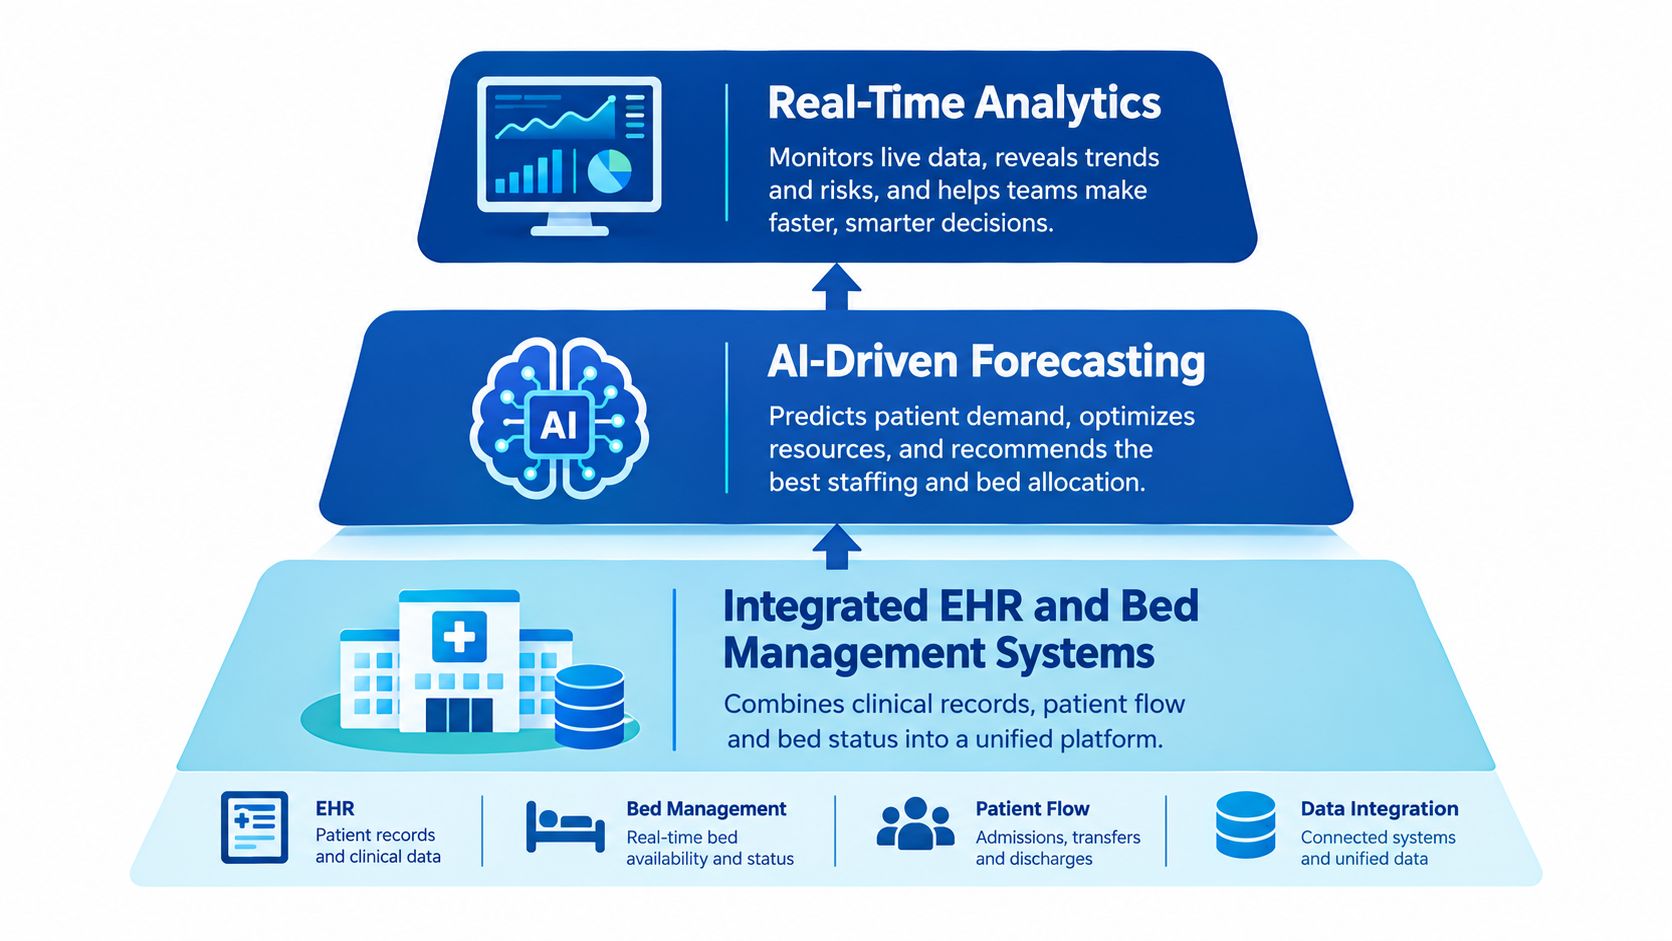
Three technology layers
Real-time analytics show current occupancy, pending discharges, boarding, staffing gaps, and unit-level constraints. Ontario Health's Hospital Pressure Dashboard provides a system-wide view across Ontario hospitals, drawing on multiple daily and near-real-time data sources. Users can filter by hospital, region, hospital type, and peer group, while the dashboard tracks adult and paediatric occupancy with week-over-week and year-over-year change.
AI-driven forecasting identifies patterns and estimates likely demand, discharge readiness, or staffing pressure. Its value depends on data quality, transparency, and appropriate human oversight. A forecast should support a decision, not create an unreviewable instruction.
Workflow automation routes tasks to the right team. Queue balancing, shift matching, absence management, escalation alerts, and discharge-task ownership can reduce the manual coordination that often slows flow.
Ontario's Bed Capacity Monitoring Dashboard, launched on 18 November 2022, was created to visualise Ministry of Health data and support a unified approach to bed-capacity oversight. That example shows why governance matters alongside interface design.
Decision test: If a dashboard identifies a constraint, it should also make the next responsible action clear.
Software buyers can explore practical considerations in this guide to healthcare operations technology. For a broader introduction to artificial intelligence use cases. Integration specialists such as Cleffex Digital Ltd can also develop custom healthcare software and connect operational systems around scheduling, staff coordination, reporting, and capacity workflows.
Implementation Roadmap for Healthcare Leaders
Technology adoption fails when leaders treat it as a software installation rather than an operating-model change. A phased roadmap helps clinical, operational, information-technology, and finance teams agree on the problem before they debate features.
Phase one: Audit the current flow
Map the patient journey from arrival to discharge. Record where teams wait for information, where ownership changes, which data are entered manually, and which decisions depend on informal conversations. Include emergency, inpatient, diagnostic, staffing, transport, housekeeping, care management, and community interfaces.
The audit should distinguish between physical capacity, staffed capacity, and available capacity. That distinction prevents a hospital from buying a bed dashboard when the actual constraint is discharge coordination or post-acute placement.
Phase two: Pilot one operational problem
Choose a unit or pathway with a clear constraint. A pilot might focus on inpatient-bed requests from the emergency department, predicted discharges, or staffing alignment for a high-variation service.
Set decision rules before launch:
Define ownership: Name the person or team responsible for acting on each alert.
Set escalation paths: Specify what happens when a barrier remains unresolved.
Protect clinical judgement: Make clear which recommendations require review.
Measure usability: Ask whether staff can interpret and act on information during a busy shift.
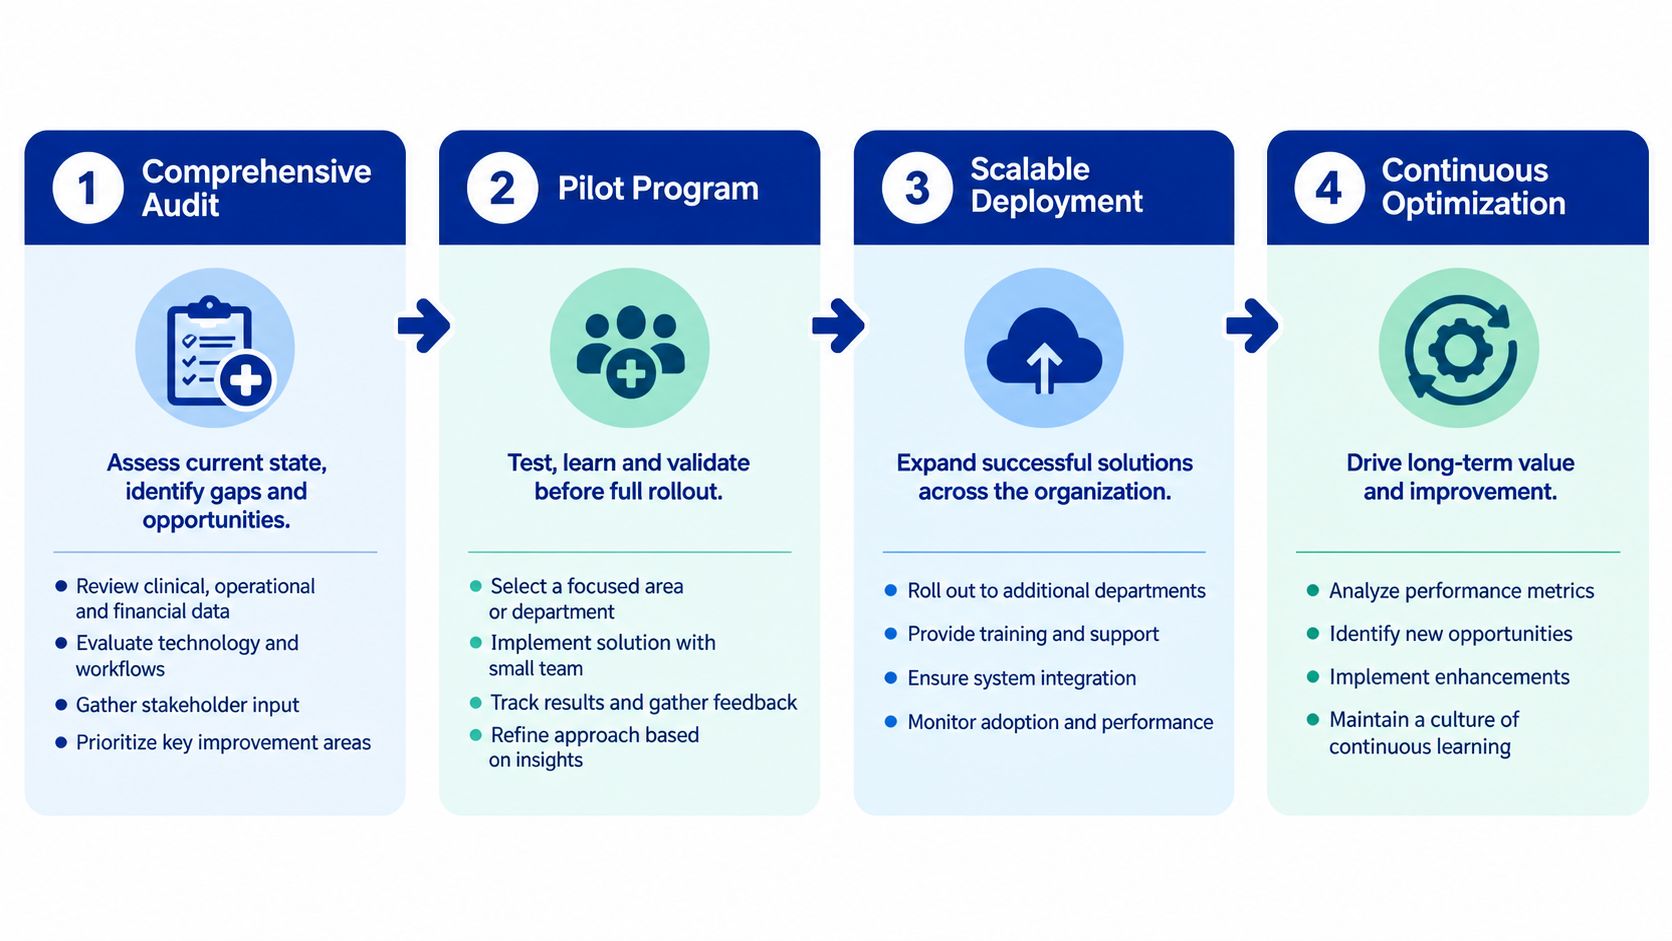
Phase three: Deploy with governance
Once the pilot produces a workable routine, extend it to connected departments. Create a governance group that includes clinical leaders, operations, privacy, security, information technology, and frontline users. Agree on data definitions, access permissions, downtime procedures, and review intervals.
Phase four: Optimise continuously
Review whether the system changes behaviour, not just whether users log in. Retire alerts that create noise, refine thresholds, and update workflows when services change. Successful healthcare resource planning becomes part of daily management, with technology supporting the rhythm rather than sitting outside it.
Real-World Success Stories in Capacity Optimisation
The evidence supplied for this article doesn't provide verified case studies with the specific outcomes described in the proposed examples. Those figures shouldn't be presented as real results. The more responsible approach is to use realistic operating scenarios without inventing performance claims.
Consider a large hospital network facing emergency-department boarding. Its leaders might discover that admitted patients remain in the ED because inpatient beds aren't released predictably. A coordinated workflow could identify likely discharges early, assign barriers to named owners, and show bed status across units. The operational benefit would be better visibility and earlier action, but the organisation would need to measure its own baseline and results.
A rural clinic faces a different problem. It may have fewer staff and less flexibility when a clinician is absent or demand changes. Predictive scheduling could combine booked appointments, local staffing availability, and service requirements to help managers allocate cover. The tool would support decisions, but it wouldn't remove the need for local clinical knowledge or contingency arrangements.
A health system using real-time flow dashboards can create a common language for bed turnover, pending transfers, discharge readiness, and emergency demand. Ontario Health's dashboards demonstrate how filtering by hospital, region, hospital type, and peer group can support operational review. The value comes from using those views in daily decisions, not from displaying data alone.
These scenarios share a principle: technology provides an advantage at handoffs. It helps teams see a downstream blockage before it becomes an upstream queue. Leaders should document the workflow change, the people responsible, and the local measures used to judge whether the intervention worked.
Measuring Success Through Key Performance Indicators
A capacity programme needs both lagging indicators and leading indicators. Occupancy and wait times show what has happened. Forecast accuracy, discharge-plan completion, unresolved barriers, and staffing readiness provide earlier signals about what may happen next.
Useful measures include:
Occupancy by unit: Separate total occupancy from staffed and usable beds.
ED boarding: Track how long admitted patients wait for inpatient placement.
Throughput: Monitor admissions, transfers, discharges, and cancellations together.
LOS variation: Look for avoidable variation by pathway, service, and discharge barrier.
Discharge readiness: Measure whether plans and dependencies are identified early enough to act.
Forecast performance: Compare predicted demand with actual arrivals and capacity needs.
Action completion: Check whether alerts lead to documented, timely decisions.
National data show why these measures need to extend beyond the hospital. CIHI reported that between 2018–2019 and 2024–2025, emergency-department wait times increased as patients arrived with more urgent conditions, while limited bed availability kept admitted patients in the ED. The same CIHI wait-time analysis links delayed discharge to constraints in long-term care and community supports.
A broader view is available in modern healthcare operations. Review KPIs in a regular operating forum, connect each measure to an owner, and change the workflow when the data show a persistent constraint.
Frequently Asked Questions
How should healthcare capacity systems address privacy and security?
A solution should support applicable privacy obligations, including PIPEDA and HIPAA where relevant to the organisation and its data flows. Buyers should examine role-based access, audit trails, encryption, secure integration, retention rules, vendor responsibilities, and downtime procedures. Compliance isn't a badge added after implementation. It must be tested through governance, configuration, training, and ongoing review.
Can capacity technology deliver a credible return on investment?
The business case depends on the local constraint and the organisation's baseline. Leaders can assess whether better flow reduces avoidable overtime, improves staff utilisation, supports retention, releases usable capacity, or increases safe throughput. They should avoid accepting unsupported savings claims and instead run a controlled pilot with agreed operational measures, implementation costs, adoption requirements, and review points.
Cleffex Digital Ltd provides custom healthcare software, integration, scheduling, staff coordination, analytics, and reporting capabilities that can support healthcare capacity management programmes. Visit Cleffex Digital Ltd to discuss a practical roadmap for connecting operational data with the decisions your teams make every day.