

A patient is waiting for laboratory results. Your receptionist can open the portal, the clinician can sign in to the electronic medical record, and the IT dashboard shows no outage. Yet the result still isn't available where the care team needs it. Healthcare software observability starts with that uncomfortable gap between a working application and a working clinical service.
Why Healthcare Software Observability Matters More Than Uptime
Consider a hypothetical clinic receiving results from an external laboratory. The laboratory sends a message, the clinic's integration engine accepts it, and the patient portal loads normally. However, the receiving system can't match the result to the intended record, so it places the message in an exception queue.
An uptime check would pass. The patient's information journey has failed.
Monitoring tells your team whether defined conditions are being met, such as whether an application responds. Observability means collecting connected evidence that helps your team understand what happened inside and between systems, including failures nobody anticipated when configuring alerts.
Electronic records don't guarantee accessible information
In 2022, 93% of Canadian primary care physicians reported using electronic medical records, up from 73% in 2015, yet only 13% of Canadian adults in 2025 reported online access to all three core record categories: laboratory and imaging results, immunisation records, and medication history or renewals.
These figures measure different things. They don't establish that software faults caused the access gap. They do show why electronic adoption alone isn't enough to demonstrate dependable access.
Compare two hypothetical operational approaches:
Uptime-only monitoring: Staff receive an alert when the portal stops responding, but must discover missing results through patient calls.
Journey-based monitoring: Staff can identify an unmatched message, see its position in the workflow and route it to someone authorised to resolve it.
The second approach doesn't replace clinical judgement. It gives operations staff evidence they can act on before a technical exception becomes an unresolved administrative task.
A green dashboard should mean the intended service is working, not merely that its servers are reachable.
For a clinic manager, the practical question is whether your team can explain an incomplete journey without phoning every supplier. Dependable HealthTech infrastructure needs visibility into availability, timeliness, completeness and authorised access, not just application health.
The Three Pillars of Observability Explained Simply
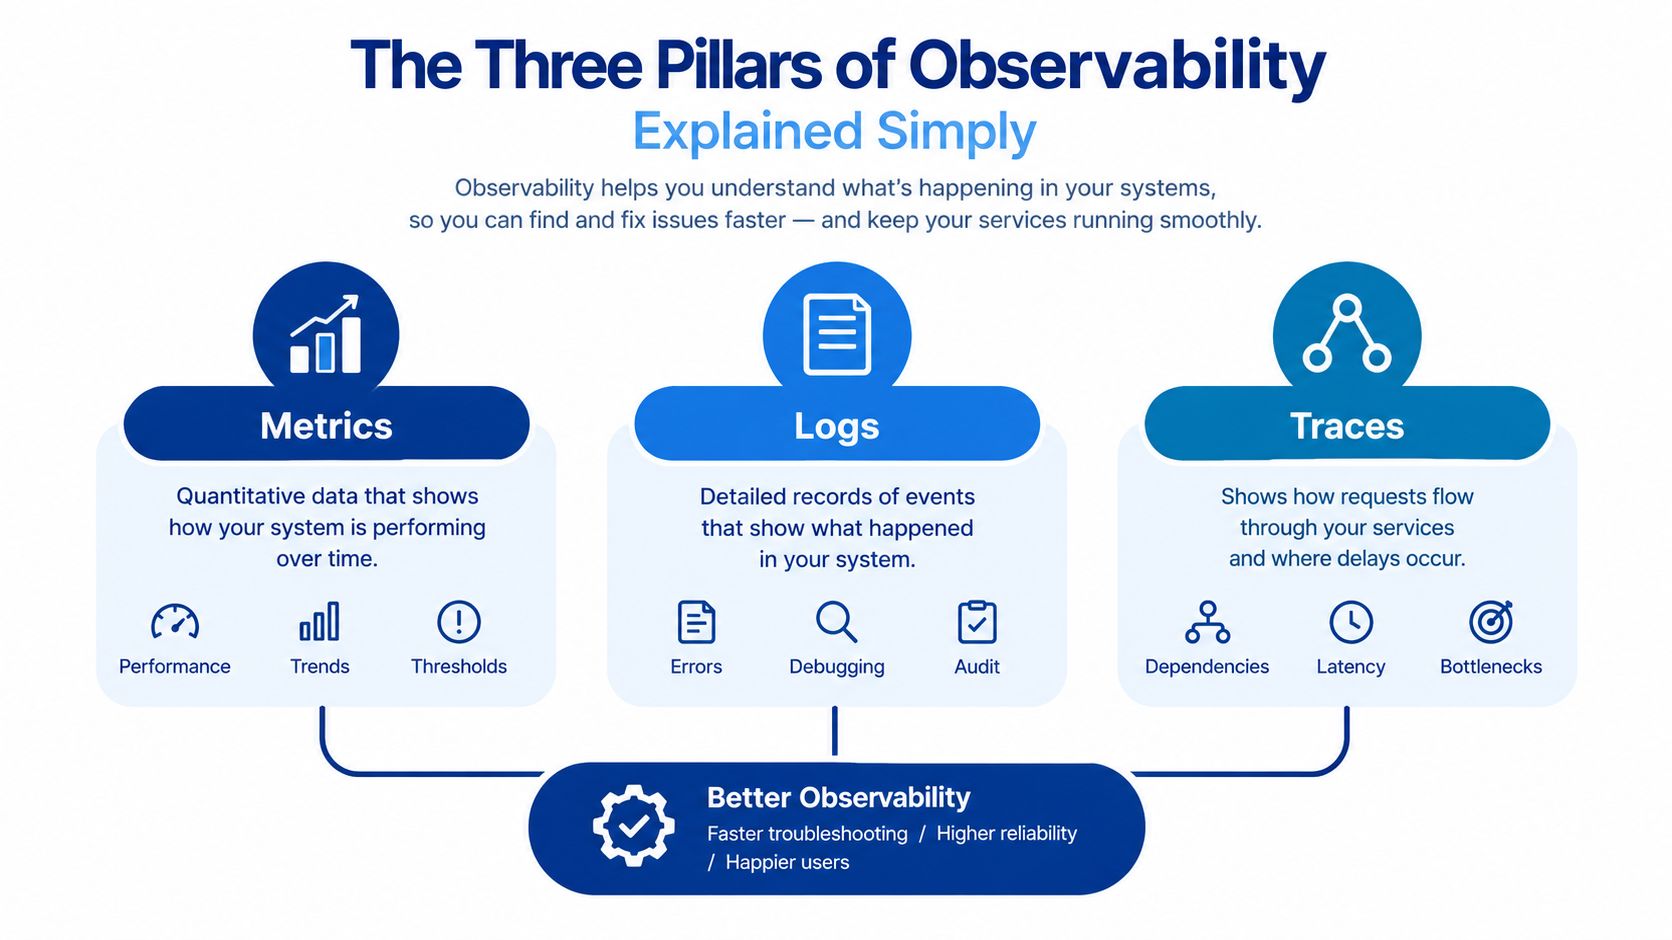
Engineers commonly organise diagnostic evidence into metrics, logs and traces. A hospital analogy makes their different purposes easier to understand, provided you remember that these are software signals, not clinical observations.
Metrics show the pattern
Think of metrics as vital signs on a monitor. They summarise behaviour over time: response times, error rates, queue depth or successful sign-ins.
For example, a growing integration queue tells an operations team that messages are accumulating. It doesn't explain whether the cause is a disconnected partner, a validation failure or insufficient processing capacity. Metrics help staff notice and prioritise a problem.
Logs explain individual events
Logs resemble dated chart entries in the analogy. Each entry describes something that happened, such as an authentication failure or a rejected interface message.
A useful diagnostic entry might identify the receiving service, rejection category and outcome. It shouldn't reproduce a patient's laboratory report to explain a processing error. The engineering task is to preserve useful context without copying sensitive content.
Traces follow a request
A trace resembles following a request from reception through the departments involved in fulfilling it. In software, it connects the steps between a portal, identity service, application and external dependency.
If a booking attempt feels slow, a trace can help distinguish time spent in the application from time spent waiting for a partner system. A correlation identifier, an opaque reference shared across related events, helps engineers connect the evidence.
Together, these signals support healthcare application monitoring:
Metrics identify the pattern: Booking failures are becoming more frequent.
Logs expose the event: A dependency is rejecting requests.
Traces locate the failing step: The rejection happens during the external scheduling call.
No single signal answers every question. Ask vendors to demonstrate how an operator moves between them during an investigation, rather than showing separate dashboards with no shared context.
How Healthcare Environments Change Observability Requirements
In an ordinary software investigation, an engineer might request more detailed logs. In healthcare, that decision also requires a privacy assessment. Diagnostic detail can become another location where personal health information is exposed.
Healthcare software reliability therefore includes the ability to investigate access without collecting unnecessary clinical information. Operational troubleshooting and privacy oversight need connected, but distinct, evidence.
Design audit records deliberately
British Columbia's Information Privacy & Security standard requires timestamped audit records for logins, logouts and access to electronic health information, including privileged administrator activity. Required details include user identity, role, originating organisation or location, IP address, affected resource and success or failure; activity logs must exclude patient clinical or demographic content and be retained for at least two years.
That standard shouldn't be reduced to a checkbox labelled “logging enabled”. Your team needs to establish whether records are complete, protected from alteration and searchable by authorised investigators.
A practical audit-event design should capture:
Who acted: The user or service identity and relevant role.
What happened: The action and affected resource reference.
When and where: The timestamp and originating context.
Why and with what result: Workflow context, where available, and the recorded outcome.
Ontario privacy guidance on logging, auditing and monitoring also addresses recording collections, uses and disclosures, including consent overrides and privacy-warning bypasses. It distinguishes recording events from reviewing them and continuously analysing them for suspicious activity.
Keep diagnosis separate from evidence
A trace used to investigate latency shouldn't be treated as a substitute for a protected privacy audit trail. Give each a defined purpose, access policy and retention schedule, while preserving safe ways to correlate related activity.
Practical rule: Collect the evidence needed to explain access, not a second copy of the clinical record.
For Canadian deployments, review telemetry destinations, administrator access and support arrangements against applicable provincial obligations and contracts. Don't assume that every organisation faces identical residency rules. The healthcare data infrastructure guide provides a useful starting point for discussing these architectural boundaries.
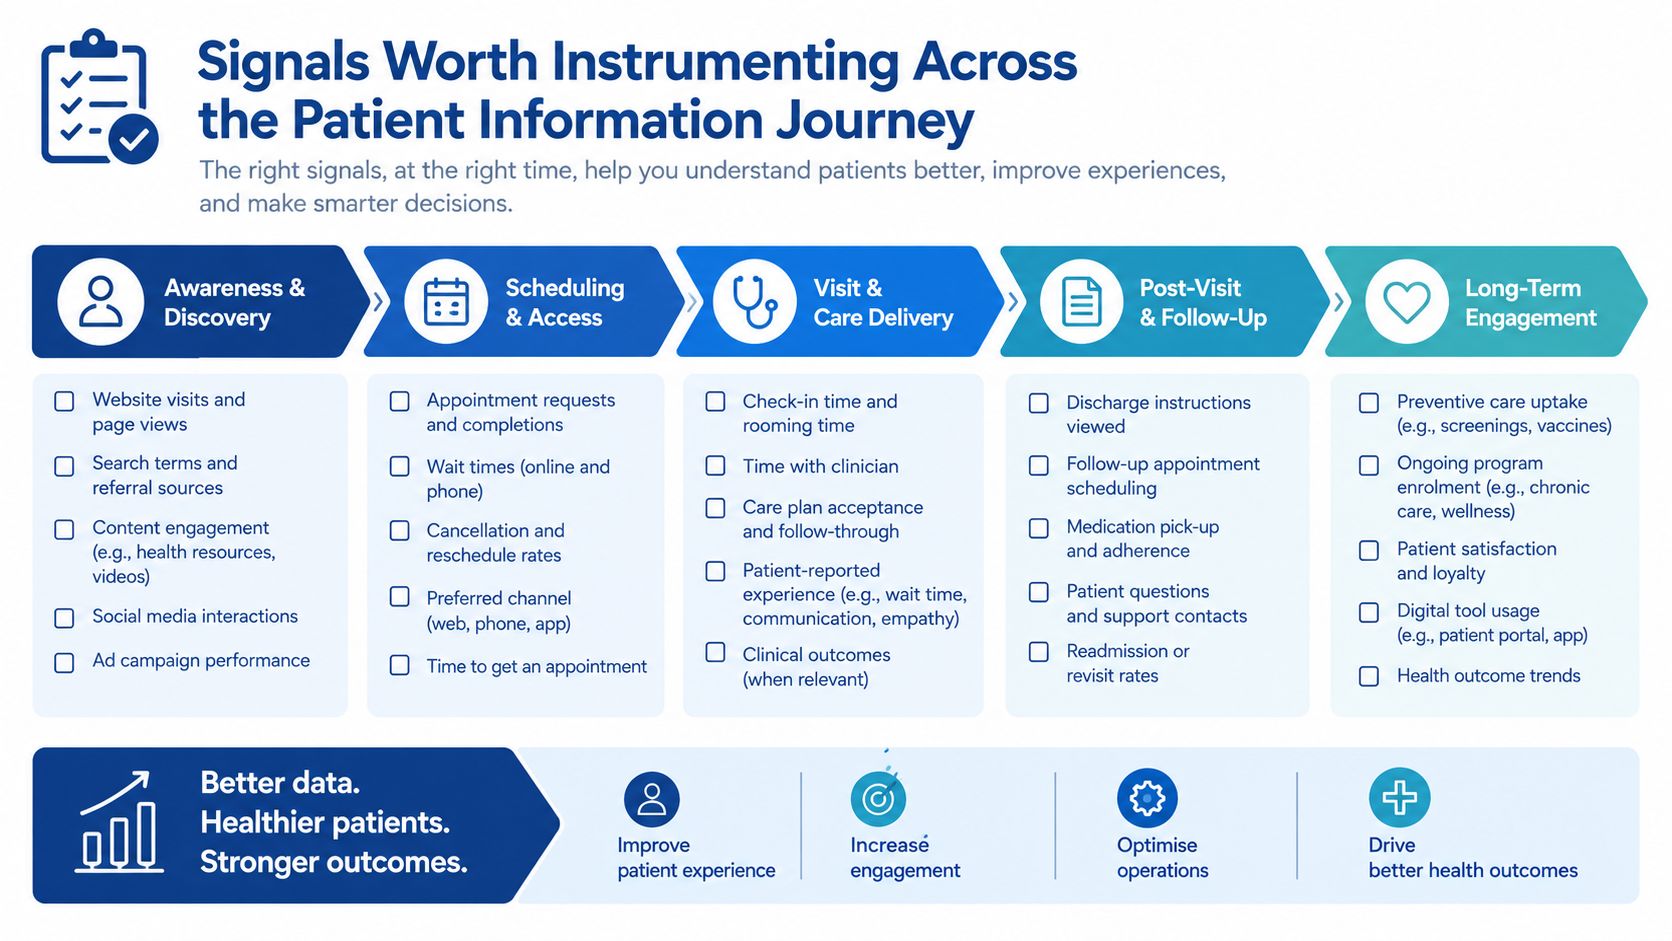
Signals Worth Instrumenting Across the Patient Information Journey
Start with a workflow your staff can describe in plain language, such as sending a referral and receiving confirmation that the destination accepted it. Mark the hand-offs, define what successful completion means and identify who handles exceptions.
This is different from checking whether an API returned a successful response. A receiving application might accept a message technically while rejecting its content later.
Choose indicators that reflect usable information
A service-level indicator is a measurement of service behaviour. For clinical integrations, choose indicators that show whether information reached its intended destination in a usable form.
| Workflow concern | Useful indicator | What to investigate |
|---|---|---|
| Failed referrals | Referral acknowledgement and completion time | Unaccepted destinations or stalled processing |
| Delayed laboratory results | Message age and unresolved queue age | Delivery failures or unmatched records |
| Duplicate records | Matching exceptions awaiting review | Identity-resolution problems |
| FHIR payload errors | Rejections by validation category | Missing fields, incompatible structures or terminology |
| Missing consent signals | Events lacking required consent context | Incomplete propagation between systems |
| Patient-summary availability | Successful retrieval with required content present | Incomplete responses or inaccessible dependencies |
FHIR, Fast Healthcare Interoperability Resources, provides a framework for exchanging healthcare information. Structural validity is only part of the task: teams should also test whether transferred values retain their intended clinical meaning.
For example, a hypothetical message could pass structural checks but map a result to the wrong local terminology. That's a semantic interoperability problem, not a server-availability problem.
Combine live signals with repeatable checks
Canada Health Infoway's Connected Care Conformance Platform provides automated tests, validation frameworks and real-time reporting against specifications including CA:Core+, CA:eReC, HALO and PS-CA. It offers a practical model for pairing runtime observation with repeatable exchange validation.
Use controlled test data to check interfaces after releases or partner changes. For consent withdrawal events, test both propagation and subsequent access decisions, with privacy-approved escalation for mismatches.
An assessment of healthcare software integration can help identify where acknowledgements, validation results and exception ownership need to be connected across existing systems.
When Systems Are Online, but Care Is Still Degrading
A supplier's service can respond normally while processing slows enough to disrupt clinic work. Staff may switch to telephone calls, temporary records or paper forms before an infrastructure alert reaches its threshold.
Clinical resilience means detecting that deterioration, supporting a safe response and confirming that recovery includes unfinished work. It isn't limited to detecting malicious activity.
Separate incident cause from operational consequence
The federal Cyber Centre's National Cyber Threat Assessment 2025–2026 describes a 2023 ransomware incident affecting five Southern Ontario hospitals that forced temporary shutdowns of internal health systems. That incident illustrates why technical disruption needs an operational response, not just a security investigation.
Ordinary technology malfunctions deserve similar preparation. A network interruption or vendor failure may have a different cause, but staff still need a safe way to recognise unavailable information, continue essential work and reconcile records afterwards.
For a hypothetical partial outage, a dashboard might show successful connections while an operations manager sees growing delays. Useful safety-aware signals would include:
Medication reconciliation exceptions: Work awaiting authorised clinical review.
Diagnostic-result queues: Results waiting for delivery, acknowledgement or follow-up.
Downtime activity: Temporary forms and locally recorded transactions requiring reconciliation.
Operational disruption: Delayed discharge documentation or diversion status, where relevant to the organisation.
These signals should support clinical escalation, not automate clinical decisions without appropriate governance.
Define recovery beyond restoration
After a supplier reports service restoration, ask whether queued transactions completed, temporary records were reconciled, and staff can trust the recovered workflow. A system can be technically restored while people are still resolving the backlog.
Recovery isn't complete when the application opens. It's complete when authorised staff have accounted for the work performed around it.
A runbook should name the technical owner, clinical escalation contact, downtime procedure and recovery checks. Broader performance engineering practices can help teams investigate capacity and dependency behaviour, but clinical leaders must define what safe degradation and recovery mean locally.
A Compact Decision Matrix for Small and Mid-Sized Healthcare Teams
Your starting point should reflect your organisation's workflows and response capacity, not the feature list of an enterprise platform. An alert has limited value if nobody knows who owns it or what action to take.
The following matrix is a planning aid, not a claim that every organisation in a category needs the same architecture.
Choosing Where to Invest in Observability by Organisation Profile
| Organisation type | Top priority signals | Lightweight starting stack | When to scale up |
|---|---|---|---|
| Single clinic | Portal access, ageing interface exceptions, audit-log continuity | Synthetic checks, existing vendor logs, scheduled review scripts | Staff can't reliably detect or reconcile failed exchanges |
| Multi-site hospital | Cross-site dependencies, diagnostic queues, downtime recovery | Shared dependency map, centralised metrics, protected audit search | Investigations repeatedly require manual evidence gathering |
| Regional insurer | Submission completion, consent context, partner acknowledgements | Transaction status reports, interface validation, access-event review | Partner complexity makes failures difficult to isolate |
| Digital health startup | Release regressions, external API failures, exchange validity | Structured logs, request tracing, automated conformance checks | Customer-specific configurations exceed the team's review capacity |
Choose between approaches by operational fit
Vendor-native monitoring is a reasonable starting point when the supplier exposes useful events, and your team can export them. Its limitation is the visibility boundary: a supplier may explain its own application without explaining the entire workflow.
A vendor-neutral layer becomes useful when staff need to correlate evidence across suppliers. Before adopting it, confirm that your team can maintain its connectors, permissions and escalation routes.
Begin with a dependency map: Record which services support the selected workflow and who owns each.
Use synthetic transactions carefully: Exercise an approved test journey using non-patient data.
Test review scripts: Confirm that they detect missing audit output as well as suspicious events.
Practise the response: Ask the intended owner to investigate a controlled failure.
Don't make comprehensive visibility a prerequisite for starting. Choose a bounded workflow, document its blind spots and expand when the evidence shows that your current approach can't support dependable decisions.
Putting Observability Into Practice Without Rebuilding Your Stack
Keep the systems that still serve their purpose. Add a vendor-neutral observability layer around their interfaces, event exports and supported monitoring capabilities before considering replacement.
The operational case should begin with a user outcome. In 2023, 81% of Canadians said they were interested in accessing their health information online, but only 39% had done so, according to CIHI's report on strengthening healthcare systems through data-driven insights. These figures don't explain every barrier, but they reinforce the need to test usable access rather than assume demand translates into successful use.
Add visibility at existing boundaries
Ask suppliers what they already expose: interface acknowledgements, structured events, health endpoints, audit exports and supported correlation fields. Avoid invasive changes when a supported integration boundary can provide the evidence.
Canada's interoperability work provides another design reference. CIHI and Canada Health Infoway launched the first drafts of the Pan-Canadian Health Data Content Framework Version 1 and Canadian Core Data for Interoperability Version 1 in September 2024, as described in CIHI's quarterly report. Teams can use applicable content expectations to shape checks for completeness and exchange behaviour.
Implementation options include supplier configuration, internal engineering or specialist integration support. Evaluate them against the same acceptance criteria:
Safe collection: Redact sensitive fields before exporting telemetry.
Controlled access: Define who can investigate operational and privacy events.
Documented location: Review storage, backups and cross-border support access.
Demonstrable response: Show that staff can detect, investigate and resolve an agreed failure.
Make acceptance practical
Don't accept a new dashboard as proof of completion. Ask the implementation team to demonstrate a failed exchange, a traceable investigation and a verified recovery using approved test data.
Before publishing associated guidance, have the content owner verify existing blog URLs, internal destinations and potential duplication. Operational documentation needs the same care: assign an owner and update it when suppliers or workflows change.
Frequently Asked Questions About Healthcare Software Observability
How does observability differ from traditional monitoring?
Monitoring checks defined conditions. Observability helps staff investigate unexpected behaviour using connected evidence. In healthcare, that investigation must account for information exchange, authorised access and workflow outcomes, not just infrastructure faults.
Does FHIR conformance guarantee reliability?
No. Conformance testing checks whether an exchange meets applicable specifications. Teams still need runtime evidence that partner systems are reachable, transactions complete, and information reaches the intended workflow.
What should a small healthcare organisation prioritise?
Choose a workflow where failure creates substantial operational risk. Identify its owner, define successful completion and test whether staff can detect and resolve an exception without relying on patient complaints.
What should we ask an integration partner to demonstrate?
Ask for a controlled failure, an investigation with appropriately protected evidence and a recovery check. Confirm who maintains the monitoring afterwards and how clinical or privacy concerns reach the right decision-maker.
Cleffex Digital Ltd offers healthcare software integration services for teams connecting clinical applications and digital health platforms. Bring a workflow diagram, an unresolved interface problem and your audit requirements to discuss where cross-system tracing, validation and protected telemetry could improve visibility without replacing your current stack.