


Canada averaged 120,140 healthcare job vacancies across the four quarters of 2022 to 2023, double the 2019 to 2020 level, according to the Canadian Institute for Health Information workforce tracking. That figure changes the scheduling question. You're not just filling a rota. You're deciding where scarce people, beds, equipment and money will do the most good, and where a gap in one will waste the others.
That's the practical case for healthcare resource optimisation supported by AI. Used well, forecasting and healthcare staff scheduling software spot pressure earlier, match skills to demand and test cover options before managers resort to overtime or agency staff. Used badly, they produce a tidier schedule while patients still wait. I would judge every tool by one test: does freed capacity become completed visits, faster admissions, shorter waits or lower cost per case?
Four Resources Every Optimisation Plan Covers
Every plan, from a small clinic to a large hospital, covers the same four resources. The scale differs, but the categories don't. Treat this table as your first audit checklist for hospital resource management.
| Resource | Common inefficiency | First lever to pull |
|---|---|---|
| Staff | Shifts filled late and predictable gaps covered by agency staff | Forecast demand by ward and skill, then start recruitment 90 days ahead |
| Beds and facilities | Beds held by patients awaiting discharge | Start discharge planning at admission and use a bed-management dashboard |
| Equipment | Scanners idle while other patients queue, and maintenance booked after breakdowns | Shared equipment calendar with a preventive maintenance schedule |
| Budgets | Spending reviewed once a year, with no cost view by service line | Monthly cost per case or visit for each service line, with an agency spend ceiling |
Why Staffing Sits at the Centre
Hospitals were the largest category in Canada's projected $372 billion health spending in 2024, at about 26% of expenditures, and employee compensation accounts for roughly two-thirds of hospital costs, according to the CIHI National Health Expenditure Trends 2024 snapshot. That's why a small scheduling improvement can matter more than a large saving on a minor supply line. It also explains why workforce decisions can't be separated from bed and budget decisions.
Facilities deserve the same discipline. A staffed bed isn't capacity if the room, support space or discharge route isn't ready. When you're reviewing whether temporary or modular space could relieve a bottleneck, the Pacific Mobile Structures medical building guide is a useful starting point for understanding the building side of that decision. Don't buy space before you've checked whether discharge delays are creating the shortage.
Equipment and budgets are where quiet waste hides. A scanner can look fully booked while urgent patients wait because slots, portering, reporting and maintenance aren't coordinated. A budget can look controlled annually while one service line relies on expensive cover every month.
First move: Pick the row where delay or cost is most visible this week, not the row that's easiest to automate.
Audit one row first. Name the owner, record the current position and pull the first lever before expanding the programme.
How Patient Flow Turns One Bottleneck Into Many
Think of a hospital as connected pipes. Block the outlet and pressure backs up through every earlier section, even if the front door looks like the problem.
CIHI describes emergency department congestion as a system capacity issue, where limited inpatient bed availability keeps admitted patients in the emergency department and reduces treatment capacity for incoming patients, in its health system performance products overview. Constrained long-term care beds and community supports also delay discharge, prolong acute care stays and block bed flow. The mechanism is queue propagation, not poor effort at one desk.

A Hypothetical Night Shift
Say an emergency department holds 14 admitted patients who are waiting for inpatient beds. Nurses work overtime to care for them in cubicles meant for new arrivals, so assessment slows. Upstairs, a medical ward has a patient who's medically ready to leave but is waiting for a home care package to start.
Adding emergency nurses may help staff cope that night. It doesn't release the ward bed. Discharge coordination, earlier pharmacy preparation, transport booking and confirmed community support treat the cause. That's the trade-off managers miss when they fund the visible queue instead of the constraint behind it.
Optimise the chain, not each stage in isolation. A faster stage that pushes patients into a blocked next stage hasn't improved access.
Track the full chain in capacity planning in healthcare:
Emergency arrivals: volume and acuity by hour
Admission decisions: time from decision to bed request
Inpatient occupancy: staffed beds, not physical beds alone
Discharge readiness: patients ready today and what's blocking each one
Alternate level of care days: days spent waiting for a more suitable setting
Community capacity: home care, long-term care and primary care availability
Flow also breaks before admission. CIHI reported 281 hospital admissions per 100,000 Canadians under age 75 in 2023 to 2024 for conditions that potentially could have been avoided through appropriate community care, in Taking the Pulse 2024. Better referral routes matter here, which is why healthcare referral automation belongs in the same conversation as bed management.
Watch total emergency department time and time waiting for an inpatient bed together. If one improves while the other worsens, you've moved the queue.
How to Build a Staffing and Capacity Plan
A useful plan starts months before a roster is published. These seven steps work whether you're using spreadsheets for a pilot or established AI healthcare operations tools across several sites.
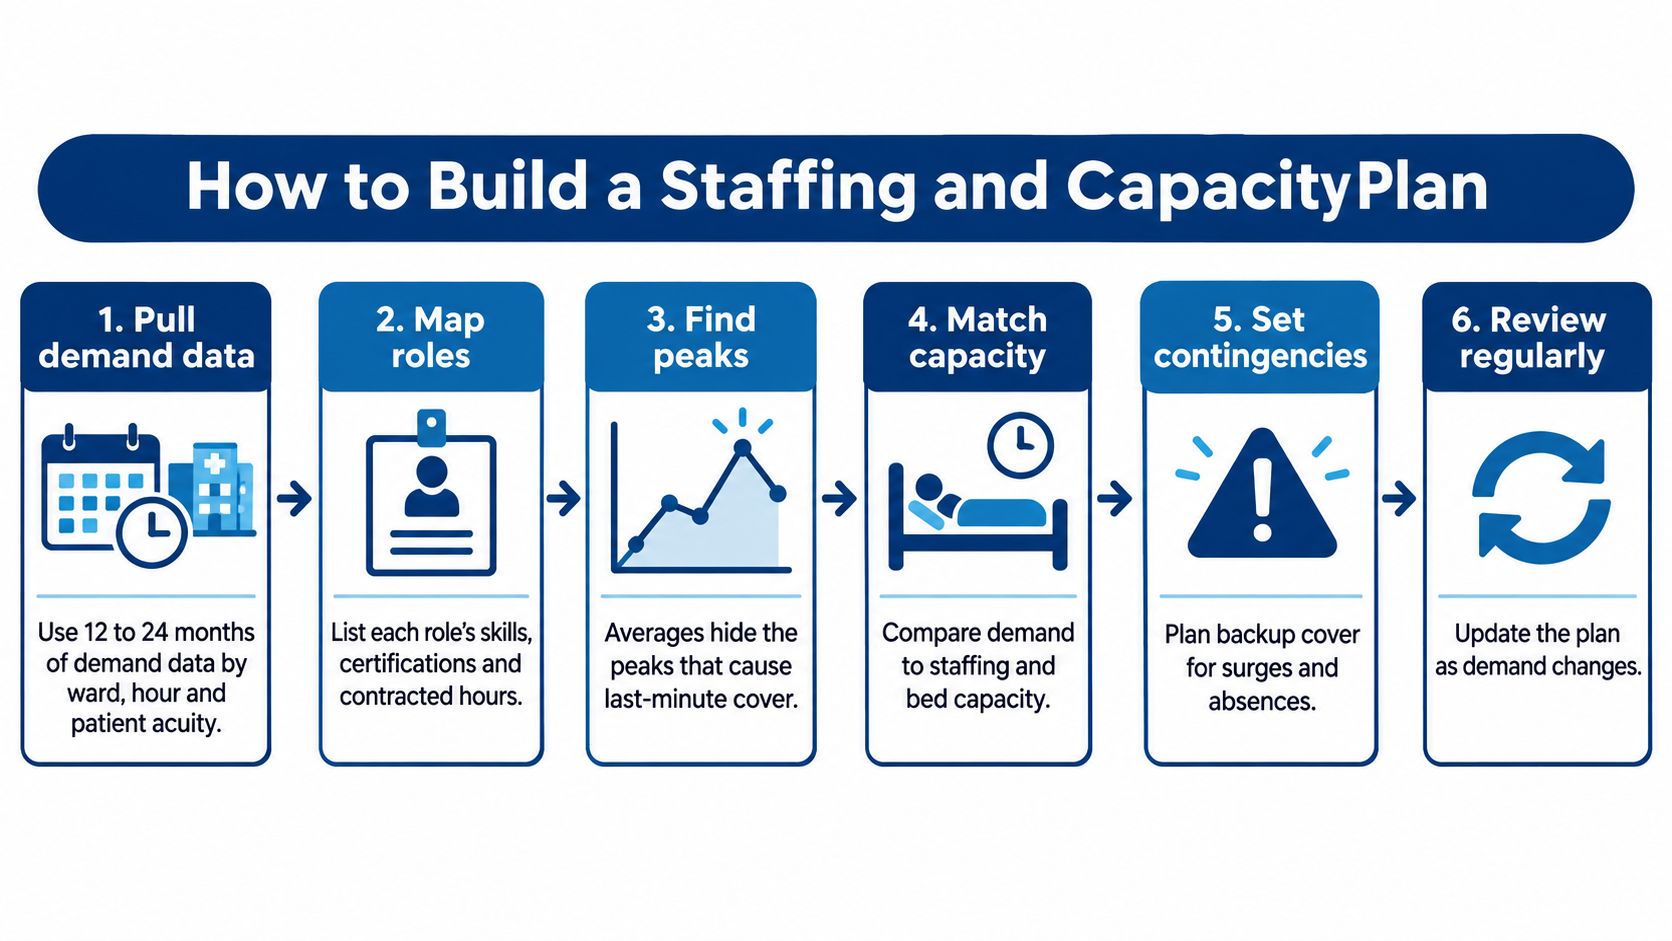
Pull 12 to 24 months of demand data by ward, hour and patient acuity. Include admissions, discharges, clinic activity, leave, sickness and seasonal peaks. Averages hide the peaks that cause last-minute cover, so plan for busy periods explicitly rather than staffing to a calm midpoint.
Map every role properly: Record skills, certifications, contracted hours, supervision limits and tasks each person can safely cover. This prevents the common error of treating headcount as interchangeable when only some staff can run a procedure, administer a treatment or supervise a unit.
Forecast vacancies, not just shifts: Use advertised days, expected attrition, retirement patterns, training and planned leave. CIHI reported that 52.5% of vacancies among Canadian nurses and allied health professionals were advertised for at least 90 days, compared with 31.6% of vacancies across all occupations, in its hospital overtime and staffing challenges analysis. Flag hard-to-fill roles early because a vacancy you spot three months ahead is a recruitment task, while the same vacancy next week becomes agency spend.
Set rules before drafting rosters: Agree rest periods, maximum hours, minimum skills mix, notice periods and swap rules first. If you add rules after a draft exists, managers spend their time repairing breaches and staff lose trust in the process.
Model scenarios for each gap: Cost a permanent hire, internal redeployment, cross-training, virtual support and agency cover side by side. Include supervision, travel, onboarding and continuity effects, not just the hourly rate, because the cheapest shift can become expensive if it creates repeat handovers or unsafe workload.
Keep human approval: Let software propose a roster and explain why each assignment fits the rules. Nurse managers and service leads should review, adjust and approve it. Automation proposes, people decide, especially where acuity or local knowledge changes the right answer.
Compare planned against actual every month: Review unfilled shifts, overtime, agency use, sickness, demand and forecast error. Then adjust establishment, recruitment timing and contingency rules. A plan that isn't corrected monthly becomes a historical document.
The common slip is buying prediction before cleaning the inputs. If ward names, role codes and contracted hours don't match across systems, a polished forecast will still mislead you.
Allocating Scarce Staff Across Urban, Rural and Remote Sites
A remote site can look fully staffed on the establishment list and still run on agency cover every weekend. Rural workforce optimisation is an allocation problem across hospital shifts, primary care, community services, virtual support and transfers, not only a recruitment problem.
The pressure is uneven. Rural and remote hospitals rely more heavily on agency staff and temporary cover than urban sites, so a single national staffing assumption understates their risk and overstates their flexibility. Specialist cover is fragile in the same places. This explainer on the causes of rural cardiology workforce gaps shows how distance, workload and limited backup shape recruitment outside major centres.
Three Allocation Steps
Build separate forecasts for urban, rural and remote sites: Use local population, admissions, travel time, vacancy lead time and service obligations. A small site may need minimum safe cover even when average demand looks low, and that cover costs money whether the shift is busy or quiet.
Match scarce roles to the whole pathway: Include minor-illness clinics, extended hours, nurse practitioner roles, community services and consultative support for rural and remote providers. Every scarce professional tied to a hospital shift is one fewer option upstream, where earlier care can prevent a transfer or admission.
Track whether targeted funding changes cover: The Canada Health Act Annual Report 2024 to 2025 reports that federal funding supported 173 full-time-equivalent positions through hard-to-recruit nursing incentives for high-demand and underserved areas, particularly rural communities. Measure filled shifts, retention and travel burden after incentives arrive, not just posts funded.
Incentives work best when schedules are survivable and virtual specialist backup supports local teams rather than replacing them. Centralising expertise can raise quality, but it weakens access if patients must travel for care a supported local team could provide safely. The test of any allocation change is whether freed capacity reaches patients through fewer avoidable transfers and shorter journeys, not whether the roster looks tidier.
Where Scheduling Software and Data Fit
Optimisation software isn't one product. It's a set of layers, and each layer answers a different planning question.
| Tool type | Question it answers | Data it needs |
|---|---|---|
| Staff scheduling software | Who works when, within rest and hours rules? | Skills, contracts, availability, shift rules |
| Capacity planning tool | How many beds and staff will we need next month? | Admissions, discharges, occupancy history, demand forecasts |
| Equipment scheduling tool | Is the scanner free, and is it due for maintenance? | Booking logs, maintenance records, usage hours |
| Budget and cost analytics | Where does spending go per case or service line? | Payroll, agency invoices, activity and case-mix data |
Connection Matters More Than Features
A scheduling tool that can't read bed demand will fill shifts for the wrong workload. A capacity forecast that can't see leave, skills or agency cost won't produce an actionable roster. This is why data connection is central to healthcare resource optimisation, not an IT extra.
A Senate of Canada committee brief citing Canada Health Infoway modelling estimates broader interoperability could address approximately $2.4 billion in annual inefficiencies, with the Patient Summary clinician productivity gain modelled at about $613 million a year at full adoption, as summarised in CIHI's digital health information overview. That clinician benefit corresponds to roughly 5.7 million hours of clinical capacity returned to care. The operational point is simple: less searching, re-entering and reconciling means more clinical time without pretending software creates new staff.
For day-to-day adoption, reminders and clear shift communication matter as much as forecasting. If you're comparing practical options, these tools for managing hospital shift reminders show the communication layer that helps a good roster survive real life. Forecasting value also depends on clean operational signals, as explored in predictive analytics in healthcare operations.
Use this checklist for any scheduling product:
Skills-based matching: Certifications and supervision rules built in
Configurable rules: Rest, hours, notice and local agreements
Clear reasoning: A stated reason for each recommendation
Human approval: No roster publishes automatically
Audit and consent controls: Who saw, changed and approved what
Ask vendors three questions before signing. How does it read data from existing rostering, payroll and bed systems? Who owns the data after go-live? How does it handle a rule change in the middle of a roster period? Vague answers here become expensive work later.
Implementation Challenges and How to Overcome Them
Most failures aren't model failures. They're data, trust and workflow failures that managers discover after purchase.
Siloed data: Warning sign: rostering, payroll and bed systems disagree on who's on shift or which beds are staffed. Fix it by agreeing on one source of truth for each field before go-live, then assigning an owner who can correct mismatches quickly.
Staff distrust of automated rosters: Warning sign: managers override nearly every suggestion and rebuild rosters manually. Show the reason behind each recommendation, involve staff representatives in rule testing and allow swaps within the rules. People accept automation faster when it explains itself and preserves fair choices.
Rules that don't match contracts: Warning sign: HR discovers breaches after publication. Write each contract and union agreement term as a scheduling rule, test edge cases with real rosters and have HR sign off before staff see the first draft.
Privacy and security gaps: Warning sign: a vendor describes controls only in general terms. Ask in writing about encryption, secure storage, anonymisation and role-based access, and check the answers against the privacy rules that apply where you operate. At Cleffex Digital Ltd, we prioritise compliance with global standards such as GDPR and HIPAA, and our development process includes strong encryption, secure data storage, anonymisation techniques and access control measures. Expect that level of specificity from any provider.
Rural and remote rollout strain: Warning sign: agency reliance stays high while local teams carry implementation work on top of clinical shifts. CIHI reported Canadian hospitals used 7.8 million hours of private staffing-agency labour in 2023 to 2024, equivalent to 4,010 full-time equivalents and around 1% of all worked hours, in The State of the Health Workforce in Canada 2024. Phase the rollout, share implementation support across a region and design for weak connectivity. A national plan that assumes urban support capacity will stall where help is needed most.
Don't automate a disputed process. Settle ownership, rules and data first, then let software speed up decisions people already trust.
Metrics That Prove Resources Moved
A metric matters only if it changes a decision. Time saved on administration should become completed visits, shorter referral waits, fewer emergency diversions or lower cost, so link every measure to a patient or financial outcome. A practical healthcare operations dashboard should show these measures together rather than celebrating schedule completion alone.
| Metric | How to calculate | Review cadence |
|---|---|---|
| Staff vacancy days | Days from posting to filled, by profession | Monthly |
| Agency hours share | Agency hours divided by total worked hours | Monthly |
| Overtime rate | Overtime hours divided by worked hours | Every two weeks |
| Bed occupancy and boarding time | Occupied beds divided by staffed beds, plus hours admitted patients wait in the emergency department | Daily |
| Equipment utilisation | Booked hours divided by available hours | Monthly |
| Cost per service line | Direct cost divided by cases or visits | Quarterly |
Use three working rules:
Record a baseline first: Measure before the change, not from memory afterwards
Compare like with like: Use the same season year on year where demand shifts seasonally
Report sites separately: Show rural and urban results apart so averages don't hide local harm
Give each metric a named manager. That person reviews movement, explains likely causes and decides what changes next. Without ownership, a dashboard becomes decoration.
Choose Your First Optimisation Target
Start where the cost of doing nothing is easiest to prove. Don't begin with an enterprise roll-out.
Pick one visible problem: Choose the row with the highest cost or delay, such as repeated agency cover on one ward or delayed discharge from one service. Narrow scope makes cause and effect easier to see.
Record a baseline for at least three months: Use the matching metric, compare the same season where possible and note known disruptions. Without a baseline, every later improvement becomes an argument instead of evidence.
Run a 90-day pilot: Limit it to one ward or service line, name the owner, fix the review date and agree in advance whether results will trigger expansion, adjustment or stopping. Include staff feedback in that decision, because a cheaper roster that increases burnout isn't a gain.
If your team lacks capacity to connect rostering, payroll, bed and clinical systems, outside help can be sensible. Cleffex Digital Ltd provides healthcare software integration for North American healthtech companies, enabling hospital connectivity, compliance, AI diagnostics and scalable platforms, and builds software for regulated healthcare systems and workflows. You can review the healthcare software integration service and the Cleffex company overview before deciding whether that support fits.
No provider replaces your process decisions. Compare any option against the baseline and metrics you chose, and keep the pilot honest enough to stop if patients don't benefit.
If your next step is connecting scheduling, capacity and clinical data so managers can act before gaps become agency shifts or blocked beds, talk to Cleffex Digital Ltd about healthcare software integration built for regulated workflows. Bring your chosen pilot ward, baseline metric and biggest data gap, and we'll help you turn that first target into a practical implementation plan.