


The day usually starts before the dashboard does. Front-desk staff are already juggling late arrivals, a clinician is running behind, one imaging slot has disappeared because equipment needs maintenance, and someone is trying to answer a simple question that shouldn't be hard: where is the bottleneck right now?
For many medium-sized hospitals and clinic networks, that is their operating model. Teams rely on exports, spreadsheets, manual huddles, and whatever one experienced manager happens to know from memory. It works until volume shifts, staffing changes, or one upstream delay cascades through the rest of the day.
That's where healthcare operational analytics stops being a reporting exercise and starts becoming an operating capability. Done well, it helps leaders move from reacting to symptoms toward managing throughput, staffing, utilisation, and service delivery with far better timing.
Beyond the Spreadsheet: The New Reality of Hospital Operations
A spreadsheet can summarise yesterday. It can't reliably coordinate today.
That gap matters more than it used to. Healthcare analytics is now a major investment area across North America. One market report projects the global healthcare analytics market will reach USD 69.74 billion in 2026 and USD 213.27 billion by 2031, with a 25.1% CAGR, and says North America holds 38.6% of the market in 2025, according to healthcare analytics market projections from MarketsandMarkets. For Canadian providers, that signals a practical reality. Your peers, vendors, and partners are operating in a region where analytics capability is already concentrated.
StatPearls also notes that healthcare analytics has evolved beyond administrative reporting into a discipline that supports predictive modelling, patient safety, care quality, and operational performance. That's exactly why operational leaders now use it for scheduling, resource allocation, and workflow decisions rather than just month-end reviews.
Why Traditional Reporting Breaks Down
Medium-sized organisations often hit a specific ceiling. They're too complex for manual coordination, but not large enough to absorb inefficiency forever.
Typical failure points show up fast:
Fragmented systems: Scheduling, EMR, billing, bed management, and HR data often sit in separate tools.
Lagging visibility: Teams review utilisation after the problem has already affected patients.
Local optimisation: One department improves its own workflow while pushing delays downstream.
Metric confusion: Different teams define wait time, capacity, or no-show rates differently.
Practical rule: If leaders need to ask three people for three versions of the same operational number, the analytics problem is already affecting patient care.
The better approach is to treat operations data as shared infrastructure. That doesn't mean building a giant programme on day one. It means creating a reliable view of what's happening across patient flow, staffing, and resource use, then putting those insights into daily decisions.
A useful starting point is to review how digital operations are changing clinic management in practice, especially in environments that have outgrown manual coordination. This perspective on modernising clinic operations aligns with what many healthcare teams are facing now.
What Good Looks Like
In strong operational environments, managers don't wait for a weekly summary to spot trouble. They can see pressure building in the schedule, identify underused assets, and adjust staffing or appointment rules before queues become visible to patients.
That's the shift. Healthcare operational analytics isn't about prettier charts. It's about giving operational teams enough trustworthy context, early enough, to prevent avoidable friction.
What Exactly Is Healthcare Operational Analytics
At 10:30 a.m., the waiting room is full, two clinicians are running behind, one procedure room is idle, and the site manager is getting three different answers about capacity. That is an operational analytics problem. The issue is not a lack of data. The issue is that the organisation cannot turn daily signals into decisions quickly enough.
Healthcare operational analytics focuses on how care is delivered across time, staff, space, and process. Clinical analytics examines outcomes, safety, and treatment patterns. Financial analytics tracks reimbursement, cost, and margin. Operational analytics deals with access, scheduling, throughput, capacity, utilisation, discharge timing, and service performance. For a medium-sized hospital or clinic network, that distinction matters because many expensive problems start as workflow failures long before they show up in quality reports or finance reviews.
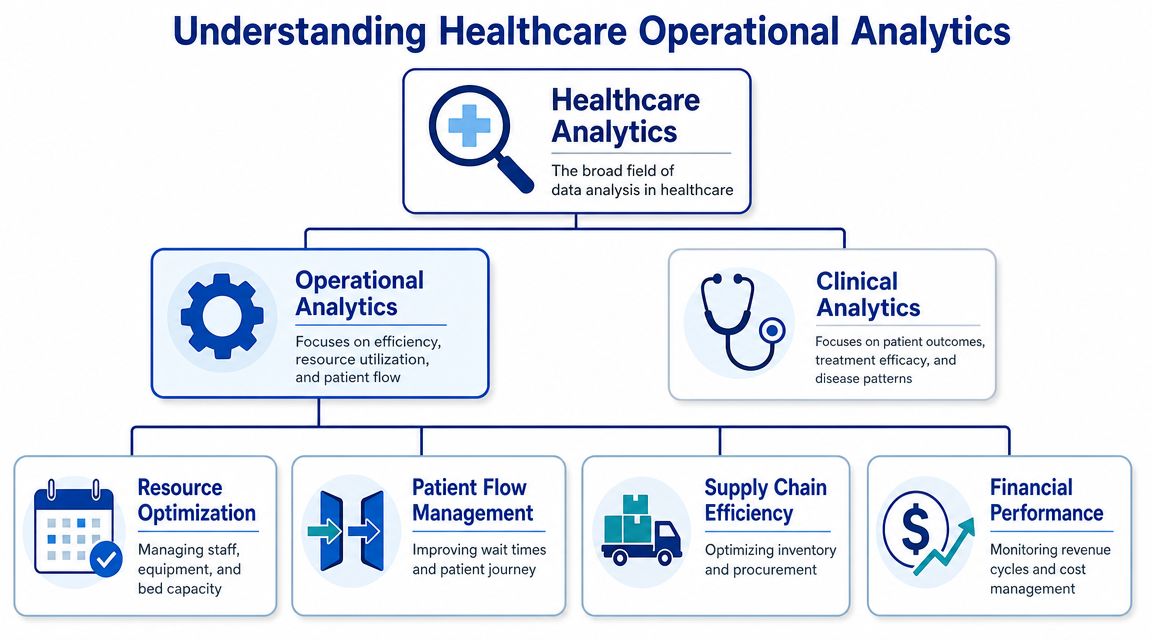
The Five Modes That Matter in Practice
Operational analytics usually matures in five modes: descriptive, diagnostic, predictive, prescriptive, and discovery. Medium-sized organisations do not need all five on day one. They do need to understand the sequence because each mode depends on the discipline established in the one before it.
Take an emergency department or urgent outpatient service.
Descriptive analytics records what happened.
Arrival volumes, average waiting intervals, room turnover, provider utilisation, and left-without-being-seen patterns sit here.Diagnostic analytics explains why it happened.
Analysts trace delays to specific causes such as a shift gap at triage, a lab bottleneck, poor room assignment logic, or a scheduling rule that creates downstream congestion.Predictive analytics estimates what is likely to happen next.
Teams forecast demand by hour, day, or season so staffing and slot availability can be adjusted before queues build.Prescriptive analytics recommends a response.
That can mean opening overflow capacity, rebalancing templates, changing float coverage, or redirecting appointments to a lower-pressure site.Discovery analytics identifies patterns the team was not actively testing for.
A common example is finding that no-show risk rises for a specific referral source, visit type, and appointment window combination.
The practical trade-off is straightforward. Descriptive dashboards are faster to deploy, but they rarely change same-day operations on their own. Predictive and prescriptive methods can improve flow and resource use, but only if timestamp quality, staffing data, and operational definitions are reliable first.
What Makes It Operational, Not Just Another Dashboard
Operational analytics is decision support for frontline management. It should help charge nurses, clinic managers, access teams, bed coordinators, and service line leaders answer questions such as:
Where is demand outpacing staffed capacity today?
Which delays are local, and which are being pushed downstream?
Which appointment rules are creating avoidable idle time or overtime?
Which sites, departments, or providers need intervention now versus trend review later?
That is a different standard from monthly reporting. In practice, the best operational programmes are built around action windows. Some decisions need a response within 15 minutes. Others need a daily planning view or a weekly template review. If the analytics product does not match that cadence, adoption falls off quickly.
A lot of these questions are time-based by nature. Arrivals by hour, room occupancy by daypart, cancellation rates by weekday, and discharge delays by service line are classic forecasting and pattern-detection problems. Teams that want a grounded refresher on these methods can use this practical time series analysis guide to connect forecasting approaches to real operational planning.
The Data Discipline Behind the Definition
Operational analytics succeeds or fails on shared definitions. Before a team builds a forecasting model, it needs agreement on what counts as arrival time, scheduled start, actual start, boarding time, discharge-ready time, cancellation reason, provider availability, and location. I have seen solid BI tools produce weak operational decisions because two departments defined the same metric differently.
For medium-sized organisations, this is where a phased approach matters. Start with a small set of cross-functional metrics tied to visible operational pain, then standardise the source fields, governance, and refresh cadence behind them. Expanding too early usually creates a polished reporting layer over inconsistent workflow data.
That foundation depends on disciplined data handling, not just better visualisation. Teams still reconciling metrics manually across departments should review this guide to mastering healthcare data management, especially before adding predictive models or automated alerts.
High-Impact Use Cases and Their Business Value
The most effective operational analytics programmes don't start with a massive data lake and a promise of “enterprise insight.” They start with a handful of decisions that affect patients every day.
For medium-sized organisations, the strongest use cases usually share three traits. They cross departmental lines, they create visible friction when they fail, and leaders can act on the findings without changing the entire enterprise system architecture.
Patient Throughput and Waiting Time Control
Patient flow is where operational weakness becomes public. People feel it in the waiting room, clinicians feel it in compressed appointments, and administrators feel it when the day runs late.
Analytics helps by exposing where time is being spent. Not just total wait time, but the intervals between referral, booking, arrival, rooming, procedure, discharge, and follow-up. That matters because most delays don't come from one dramatic failure. They come from stacked micro-delays.
Useful interventions often include:
Template redesign: Adjusting appointment lengths by visit type instead of using one default slot length.
Queue segmentation: Separating urgent, routine, and procedure-dependent flows so one queue doesn't distort all others.
Front-end demand management: Better booking logic and automated reminders for patient appointments can reduce avoidable schedule disruption.
The business value is straightforward. Smoother throughput improves access, lowers visible congestion, and makes each unit of capacity work harder.
Capacity Planning for Beds, Rooms, and Equipment
Most organisations think they have a capacity problem when their real issue is coordination.
A bed may exist on paper, but be unavailable because discharge timing, transport, cleaning status, and admission timing aren't synchronised. An imaging unit may be technically available while remaining underused because bookings cluster poorly. Analytics makes these mismatches visible.
What works is a planning model that combines historical utilisation patterns with operational constraints. What usually doesn't work is relying on average utilisation alone. Averages hide peaks, handoff delays, and variation by service line.
The right capacity question isn't “How full are we?” It's “Which constraints repeatedly stop us from using capacity when demand appears?”
Workforce Scheduling and Utilisation
Staffing is where cost pressure and service pressure collide. Too little coverage creates delay, burnout, and rushed care. Too much coverage wastes expensive clinical time.
Operational analytics can help leaders compare scheduled labour against actual workload by shift, location, speciality, and appointment type. It can also reveal where roster design creates predictable strain, such as repeated lunchtime backlogs or end-of-day overruns.
The goal isn't surveillance. It's alignment. Teams need enough staffing to match actual flow, not a static plan that looked reasonable a month ago.
Use Cases, KPIs, and Data Sources
| Use Case | Key KPIs | Primary Data Sources |
|---|---|---|
| Patient throughput management | Wait time, cycle time, appointment lead time, queue length, no-show pattern | Scheduling system, EMR timestamps, registration data, referral data |
| Capacity planning | Bed occupancy trend, room utilisation, equipment downtime pattern, discharge timing, slot fill rate | Bed management system, ADT feeds, scheduling platform, maintenance logs |
| Workforce scheduling | Staff utilisation, overtime pattern, shift coverage gaps, clinician session variance | HRIS, rostering system, scheduling data, encounter volumes |
| Post-discharge coordination | Follow-up completion, referral closure, missed follow-up pattern, readmission risk signals | EMR, care coordination notes, scheduling data, contact centre records |
Many organisations also use AI to move from passive reporting to alerts, workflow prompts, and decision support. This discussion of AI automation for healthcare insights and ROI is relevant if your team is deciding which operational tasks should remain analyst-led and which should become automated.
The biggest lesson from these use cases is that ROI rarely arrives as one giant saving. It shows up as fewer wasted slots, better use of staff time, less friction for patients, and fewer operational surprises.
Building Your Analytics Technology Foundation
A useful analytics stack doesn't need to be exotic. It needs to be dependable, governed, and built around operational workflows instead of vendor demos.
For most medium-sized providers, the architecture should answer one basic question: how does data move from the systems running care delivery into trusted metrics that managers can act on daily?
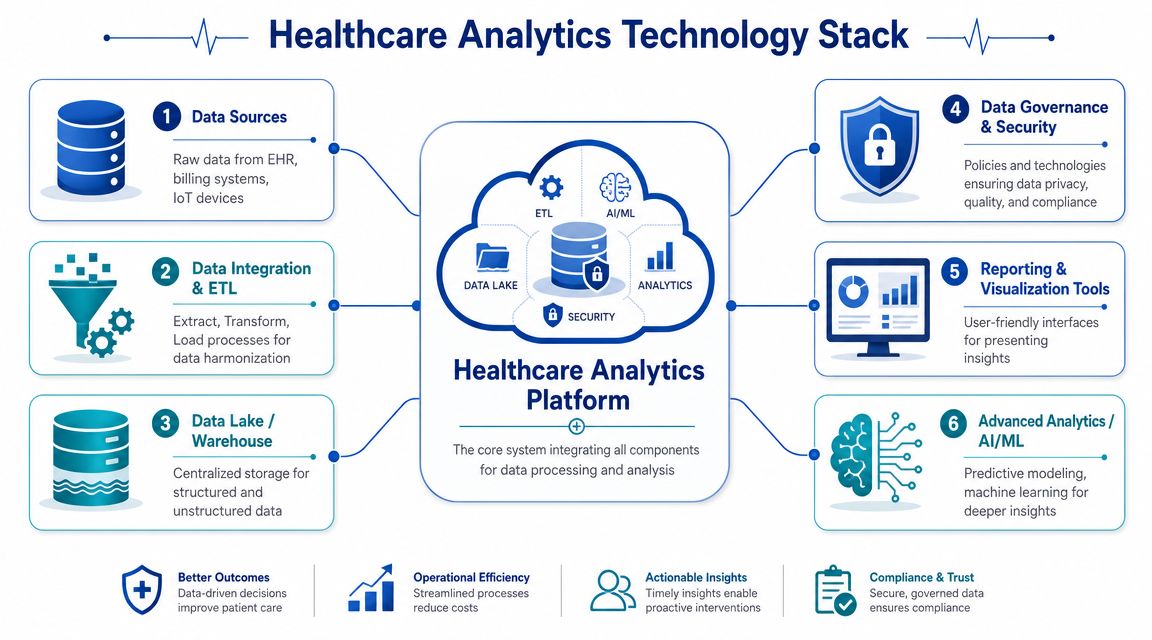
Start With Source Systems, Not Dashboards
Dashboards are the visible layer. The harder work happens underneath.
Typical operational data sources include:
EMR or EHR platforms: Encounter events, orders, discharges, clinical workflow timestamps
Scheduling systems: Appointment creation, reschedules, cancellations, provider templates
Billing and claims systems: Authorisations, denials, service coding, payer lag indicators
HR and rostering tools: Staffing plans, shift coverage, leave, overtime
Asset and facilities systems: Equipment availability, maintenance status, room readiness
Contact centre and patient communication tools: Call volumes, callback intervals, reminder activity
If those systems don't share identifiers cleanly, analysts end up doing manual reconciliation. That's where many programmes stall.
The Stack That Usually Works
A practical healthcare operational analytics stack has six layers:
Ingestion and integration
Data pipelines pull records from operational systems on a defined schedule or near real-time, where needed.Transformation and Standardisation
Teams map local codes, align timestamps, clean duplicates, and create shared definitions.Data Storage
This is usually a warehouse, lakehouse, or a combination of both, depending on reporting and modelling needs.Semantic Modelling
Business-friendly models turn raw tables into consistent metrics such as utilisation, throughput, demand, and delay.Visualisation and Workflow Delivery
Dashboards, alerts, and embedded reports deliver insights to managers, charge nurses, and administrators.Advanced Analytics
Forecasting, anomaly detection, and decision support sit here once the lower layers are stable.
Why Cloud Has Become the Default Pattern
For healthcare operations, cloud delivery is no longer the edge case. Mordor Intelligence estimates that cloud-based platforms held 56.78% of the global healthcare operational analytics market in 2025 and are growing at a 13.41% CAGR through 2031, while software held 45.92% of the market share in 2025, according to this healthcare operational analytics market analysis.
Those numbers matter because they reflect a deployment pattern, not just a buying preference. Cloud platforms make it easier to scale compute for large encounter datasets, refresh models more frequently, and compare performance across multiple sites without building everything from scratch in each location.
For Canadian operators, the practical design choices are usually:
Cloud-native ingestion: So new data sources don't require a new mini-project each time
Role-based access: So managers see what they need without overexposing patient information
Reusable semantic models: So, throughput or utilisation means the same thing across clinics
Auditability: So every metric has lineage back to source data and transformation logic
Don’t Overlook Unstructured Inputs
Operational blind spots often sit in PDFs, scanned forms, referral packets, maintenance notes, and fax-derived workflows. If those documents are still handled manually, teams miss signals that matter.
That's where document automation can help. This overview of intelligent document processing is relevant for healthcare environments trying to extract operational data from referrals, intake forms, and other semi-structured documents without creating another manual backlog.
Architecture choice matters less than metric trust. If teams don't believe bed status, room readiness, or provider availability data, they'll go back to calls, messages, and whiteboards.
The best foundation is usually modest at first. Build a narrow but reliable pipeline, prove that the metrics are trusted, and only then widen the footprint.
A Phased Roadmap for Implementation and Governance
Medium-sized healthcare organisations don't need an enterprise analytics transformation as a first move. They need a sequence that reduces risk, produces visible value, and puts governance into daily practice.
That sequence works best in three phases.
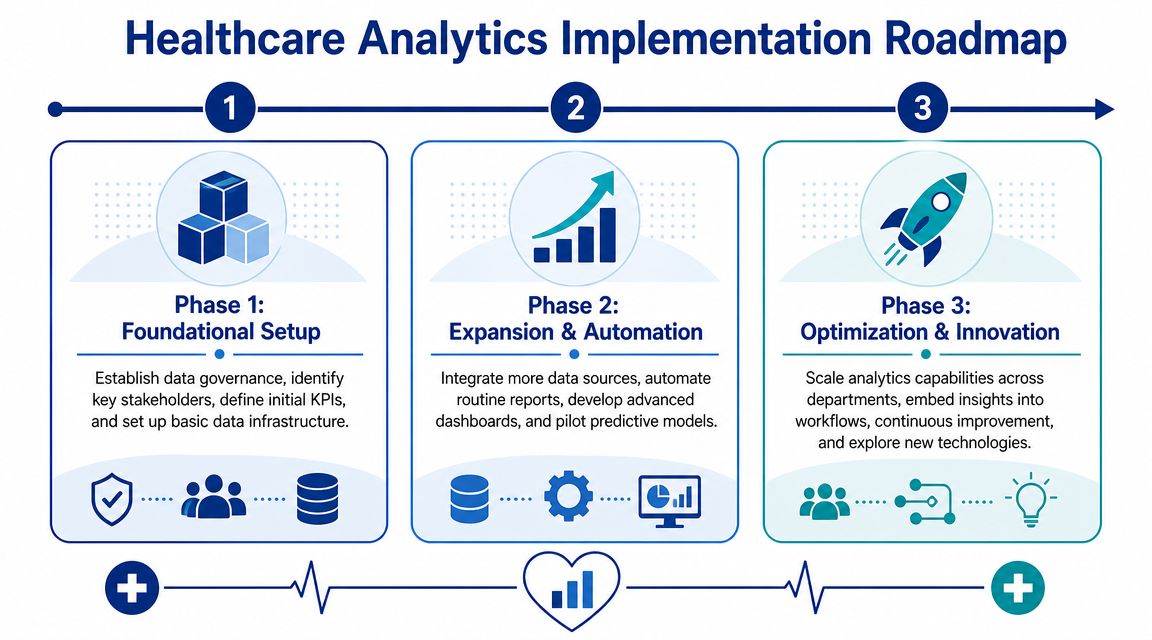
Phase One Begins With One Operational Pain Point
Start with a pilot that has obvious operational consequences and data you can access. Patient throughput, no-show management, imaging utilisation, or discharge flow are common candidates.
The pilot needs a compact governance model from day one:
Name a business owner: Someone responsible for acting on the findings, not just attending update meetings
Define the metric clearly: One agreed definition for wait time, utilisation, cancellation, or delay
Limit access intentionally: Apply least-privilege access from the beginning
Track data quality issues openly: Missing timestamps and duplicate encounters shouldn't be hidden in analyst notes
For Canadian organisations, this is also where compliance habits need to form. That includes privacy-by-design thinking, controlled access to personal health information, and documented handling rules aligned with PIPEDA where applicable, plus provincial health privacy obligations. If the organisation has cross-border processing or vendor relationships touching US-regulated workflows, HIPAA considerations may also enter the design conversation.
Phase Two Expands Coverage Without Losing Control
Once the first use case is trusted, add adjacent workflows rather than unrelated ones. A throughput pilot might extend into staffing alignment, then into room and equipment planning.
This phase often fails when organisations scale dashboards faster than governance. Avoid that by formalising:
A metric catalogue so each KPI has an owner, definition, and approved calculation logic.
Data lineage records so teams know where each operational measure originates.
Role-based dashboard views so that a unit manager, executive sponsor, and analyst don't all see the same thing by default.
Change control for definitions and pipeline updates.
A medium-sized provider doesn't need a giant governance council to do this well. It needs a small operating rhythm. Usually, that means a recurring review involving operations, IT, analytics, and privacy stakeholders.
Governance isn't a legal wrapper added at the end. It's the set of decisions that determines whether staff trust the system enough to use it.
Phase Three Embeds Prediction Into Workflow
Only after descriptive and diagnostic reporting are stable should teams move into predictive or prescriptive work. Organisations often get distracted by AI tooling before they've fixed timestamp quality, identity matching, or workflow ownership.
The stronger path is narrower:
Forecast demand in a single service line.
Trigger an alert when risk conditions appear.
Put a named team or manager in charge of acting on the alert.
Measure whether the action changed the operational outcome.
At this stage, governance becomes more than access control. It also includes model oversight, version control, review of false positives, and monitoring for workflow drift. If a predictive signal causes extra work but no meaningful operational improvement, remove it.
A Governance Checklist That Holds Up in Practice
For medium-sized organisations, these controls usually matter most:
Access governance: Role-based permissions, approval workflows, and audit logs
Data quality governance: Required fields, timestamp monitoring, exception queues
Metric governance: Standard definitions, owner assignment, version history
Compliance governance: Data minimisation, retention rules, vendor review, incident response
Workflow governance: Clear actions tied to specific thresholds or alerts
A phased rollout works because it respects how healthcare operations change. Teams adopt analytics when it removes friction from the day, not when it produces a complex architecture diagram.
Measuring Success and What It Looks Like in Practice
A successful operational dashboard doesn't try to impress everyone at once. It gives each role the few signals they need to make a better decision during the shift, the clinic day, or the weekly planning cycle.

What a Useful Dashboard Includes
For a charge nurse, a good view might show current bed status, pending discharges, room turnover blockers, and incoming admissions. For an outpatient operations manager, it might show arrivals, no-shows, clinic delays, provider variance against schedule, and next-available slots.
What matters is context and actionability:
Role-specific views: Different users need different levels of detail
Fresh enough data: Not every metric must be real-time, but it must be timely enough for the decision
Exception visibility: Highlight what needs attention instead of burying it in a summary
Operational ownership: Every alert or threshold should map to a person or team
A Representative Clinic Story
Consider a medium-sized multisite clinic network dealing with crowded mornings and underused afternoons. Leaders initially blamed staffing levels. The analytics work showed a different pattern. Appointment templates were uneven, check-in delays clustered at specific locations, and follow-up visits were booked into peak periods even when they didn't need the same time sensitivity as new assessments.
The organisation started with one service line. It cleaned scheduling data, standardised visit types, created a shared definition of wait time, and gave local managers a daily throughput view. After teams began adjusting templates and redistributing appointment types, the clinic cut patient wait times by 25% and improved resource scheduling.
That result is a hypothetical example, not an external case study. The point is the mechanism. Improvements usually come from fixing operational design, then reinforcing it with reliable analytics.
A mature healthcare operational analytics programme feels less like reporting and more like an operations command centre.
The organisations that get value from this work don't chase analytics for its own sake. They use it to reduce avoidable delays, make better use of scarce resources, and give frontline teams clearer visibility into the day they're trying to run.
Cleffex Digital Ltd helps healthcare organisations turn complex operational challenges into practical digital systems, from secure data platforms to compliant analytics workflows and custom software delivery. If your hospital, clinic network, or healthcare venture needs help building a dependable analytics foundation, explore Cleffex Digital Ltd.


